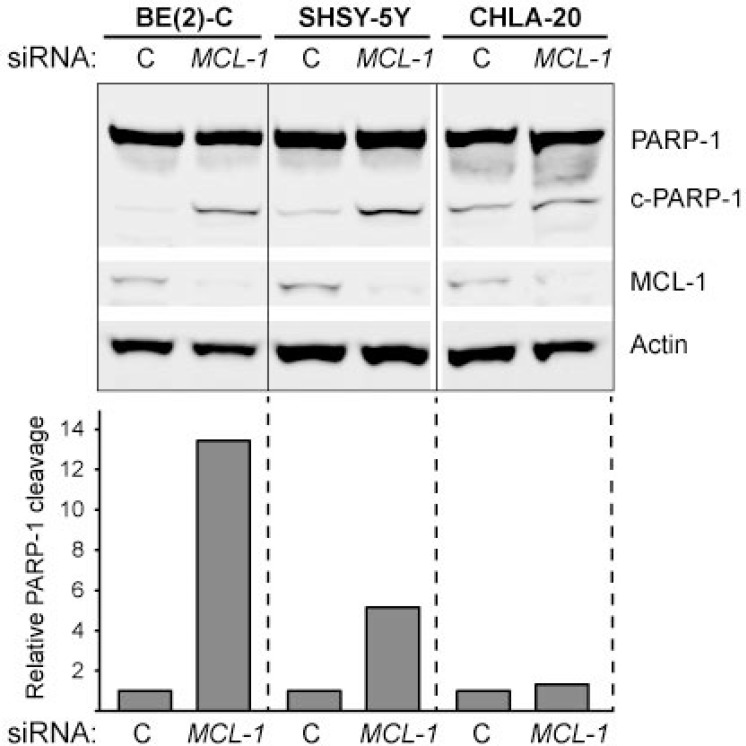
Figure 12. PARP-1 cleavage in response to MCL-1 knockdown in neuroblastoma.
Cells were transfected with control siRNA or MCL-1 siRNA for 24 hours. Actin was used to demonstrate equal protein loading. PARP-1 was quantified using ImageJ; data are expressed as the ratio of cleaved PARP-1 to uncleaved PARP-1 and relative to control-transfected cells (set to 1). The experiment was performed at least two times giving similar results, and the result from one representative experiment is shown.

