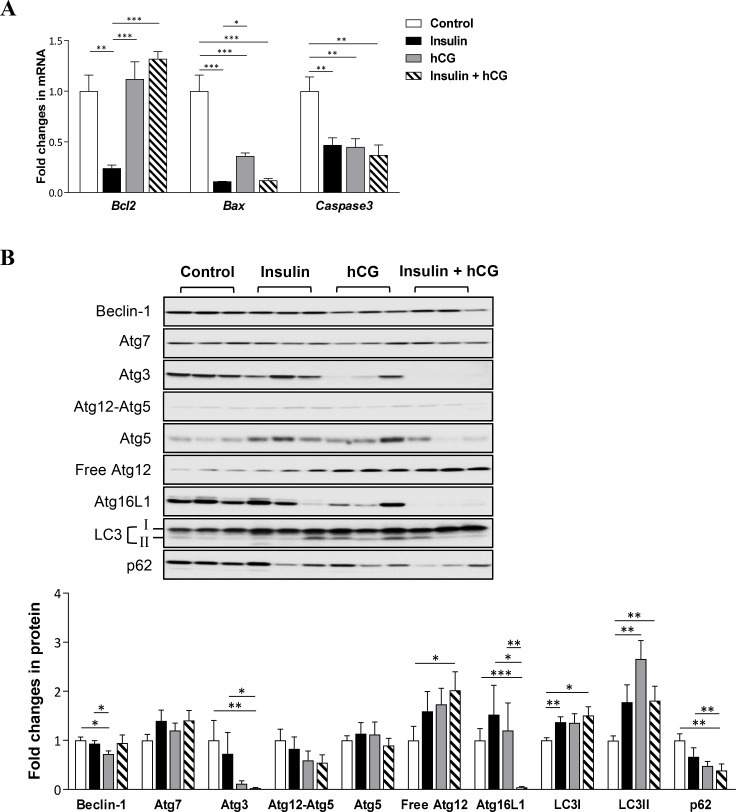
Figure 7. Effects of insulin and/or hCG on apoptosis and autophagy in the rat liver.
Relative levels of mRNAs (A) and proteins (B) of pro-apoptotic and anti-apoptotic genes and autophagy-related proteins were determined by qRT-PCR and Western blot analysis. For immunoblotting quantification, total proteins served as the loading control. Data in A represent means of n = 6/group ± SEM, and the data in B are means of n = 9/group ± SEM. *p < 0.05; **p < 0.01; ***p < 0.001.

