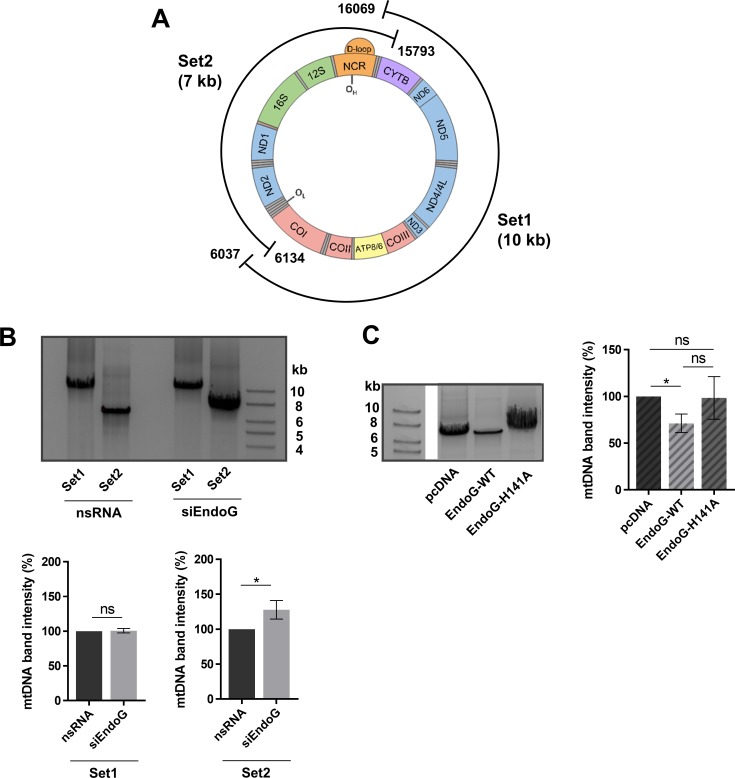
Figure 4. EndoG's role in mtDNA degradation.
(A) Scheme of positions of primer pairs for long-range PCR Set1 and Set2, which cover the whole mitochondrial genome in two overlapping segments. Set1 amplifies a fragment of 10,033 bp and Set2 a fragment of 6,910 bp (on a genome of 16,569 bp, NC_012920.1 GenBank). (B) Upper panel: representative image of agarose gel electrophoresis of long-range PCR on total genomic DNA isolated from HeLa cells grown in glucose medium and transfected with control nsRNA or siEndoG and subsequent cultivation for 48 h. Lower panel: quantification of 10 kb Set1 (n = 5 independent experiments with Hela cells grown in glucose medium) and 7 kb Set2 (n = 12 of 6 independent experiments with Hela cells grown in glucose or galactose medium) mtDNA band intensities after long-range PCR. (C) Left panel: representative image of agarose gel electrophoresis of long-range PCR on total genomic DNA isolated from HAP1 EndoG knockout cells transfected with a control plasmid or a plasmid expressing EndoG-WT or the catalytically inactive EndoG-H141A mutant for 48 h. The framed images were derived from the same agarose gel, obtained with the same exposure time. Right panel: quantification of Set2 mtDNA band; n = 8 independent experiments showing an decrease after EndoG-WT expression. Data are expressed as mean ± SEM (ns, not significant; *P < 0.05; Wilcoxon matched-pairs signed rank test).

