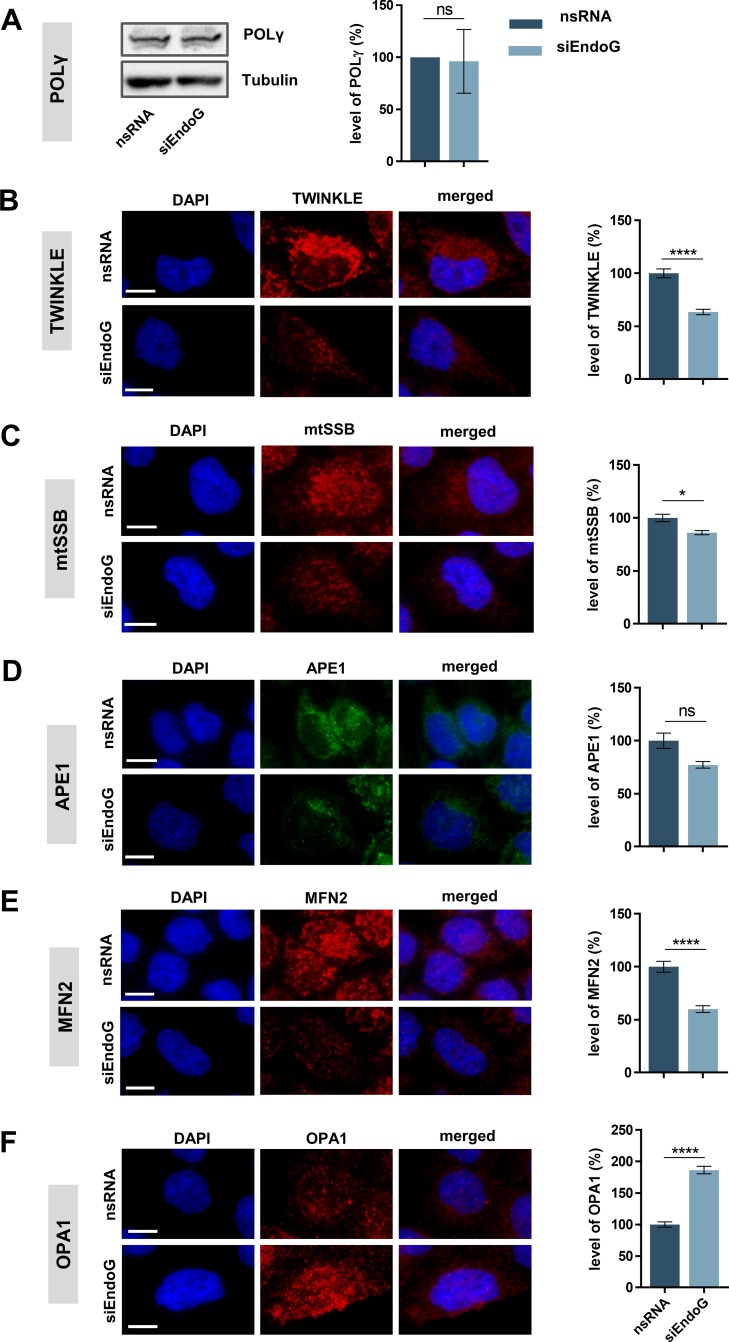
Figure 6. Impact of EndoG on expression of factors involved in mitochondrial genome replication, BER or fusion.
HeLa cells were grown in galactose medium (72 h) and transfected with control nsRNA or siEndoG and cultivated for 48 h. (A) Left panel: representative image of Western blot analysis of POLγ expression; right panel: quantification of Western blot analysis. n = 4 independent experiments. (B–F) Representative immunofluorescence microscopic images (left panel) and fluorescence-based quantification (right panel) of protein levels of (B) TWINKLE n = 120, (C) mtSSB n = 110–127, (D) APE1 n = 157–171, (E) MFN2 n = 157–171 or (F) OPA1 n = 103–141 cells from 2 independent experiments each. Data are expressed as mean ± SEM (ns, not significant; *P < 0.05; ****P < 0.0001; non-parametric Mann-Whitney test for unpaired samples); Scale bars = 10 μm.

