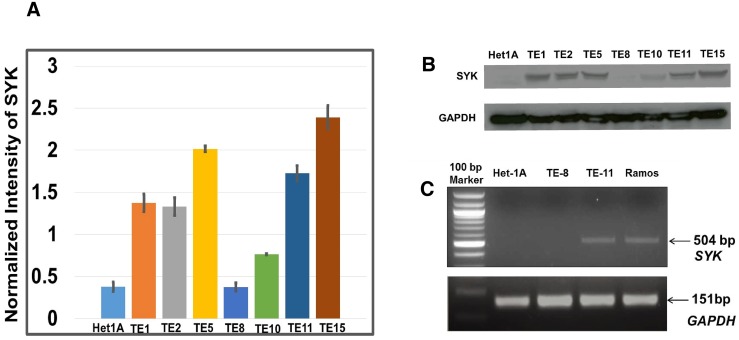
Figure 2. Expression of SYK across ESCC cell lines and non-neoplastic esophageal epithelial cell line.
(A) Histogram showing expression of SYK in ESCC cell lines as determined by RPPA array. (B) Expression of SYK across ESCC cell lines by Western blotting. (C) RT-PCR based evaluation of SYK expression in TE8, TE11 and Ramos cell lines. Ramos cell line was used as positive control.

