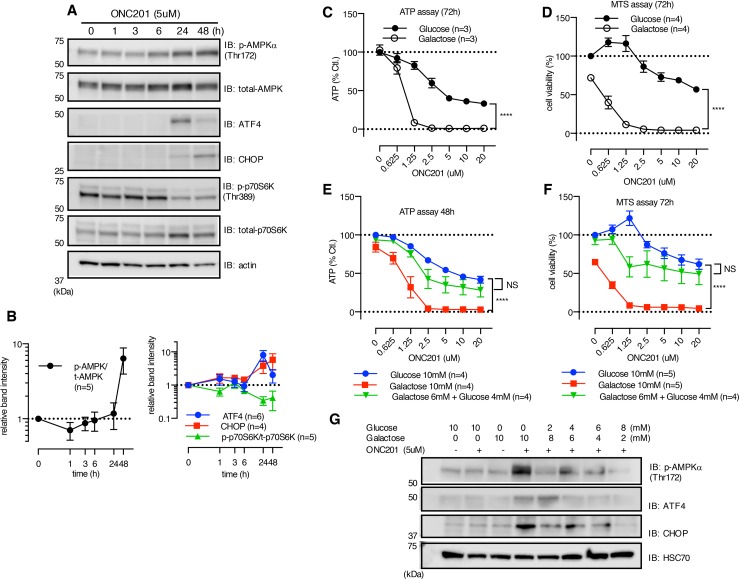
Figure 2. ONC201 induces AMPK activation.
(A) Western blot showing the effect of ONC201 on MB231 cells at indicated time points. (B) Quantitative analysis showing band intensity of p-AMPK normalized with t-AMPK (left panel), and ATF4/CHOP and p-p70S6K (right panel). ATF4 and CHOP were normalized with loading control (actin or HSC70), and p-p70S6K was normalized with total-p-70S6K. Results are shown as mean +/− SEM of multiple independent experiments. (C and D) ATP (C) and MTS assay (D) of MB231 treated with ONC201 in glucose (10mM) or galactose (10mM) medium for 3 days. Results are shown as mean +/− SEM of 3 (ATP assay) or 4 (MTS assay) independent experiments of triplicates for each dose point. ****p<0.0001, two-way ANOVA. (E and F) Rescue by addition of supplemental glucose of ONC201-induced reduction of ATP level (E) and cell viability (F) in galactose medium with MB231 cells. Results are shown as mean+/− SEM of 4 independent experiments. ****p<0.0001, NS= not significant, compared to glucose 10mM (two-way ANOVA). (G) Western blot showing rescue effect of supplemental glucose on ONC201-induced AMPK activation, ATF4 and CHOP induction.MB231 cells were treated with indicated conditions for 24 h. Data shown is one representative result of multiple experiments.

