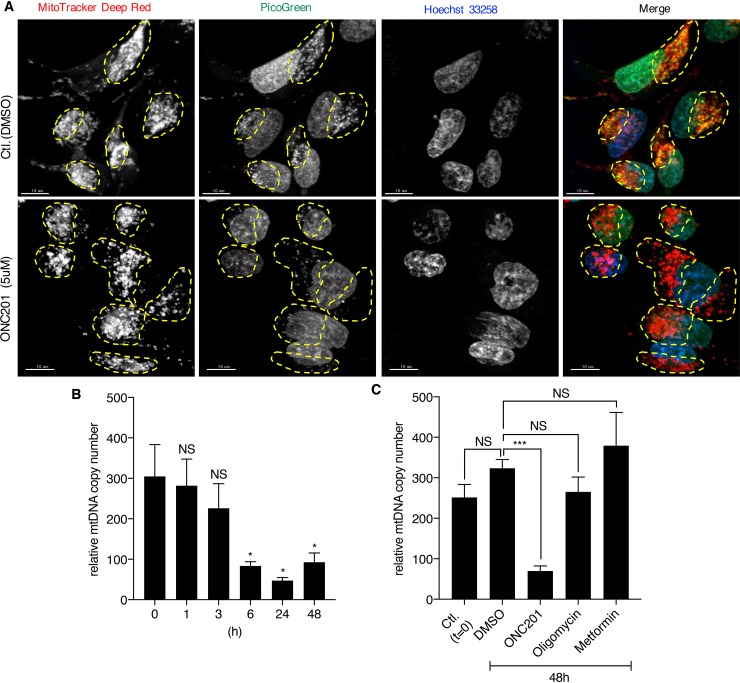
Figure 5. ONC201 depletes mtDNA.
(A) Confocal microscopy images of MB231 cells. Cells were treated with DMSO (Ctl.) or ONC201 (5μM) for 24 h in glucose medium, followed by co-staining with MitoTracker Deep Red (red), PicoGreen (green) and Hoechst (blue) prior to image acquisition. Mitochondria in each cell are indicated by yellow dotted circle. Scale bar=10μm. (B) Quantitative analysis of relative mtDNA copy number of MB231 treated with ONC201 (5μM) for different times. Results are shown as mean +/− SEM of 4 independent experiments. *p<0.05, NS=not significant (t-test vs. time zero). (C) Quantitative analysis of mtDNA copy number of MB231 treated with ONC201 (5μM), oligomycin (1nM) or metformin (5mM) for 48 h in glucose medium. Results are shown as mean +/− SEM of 3 independent experiments. ***p<0.001, NS=not significant.

