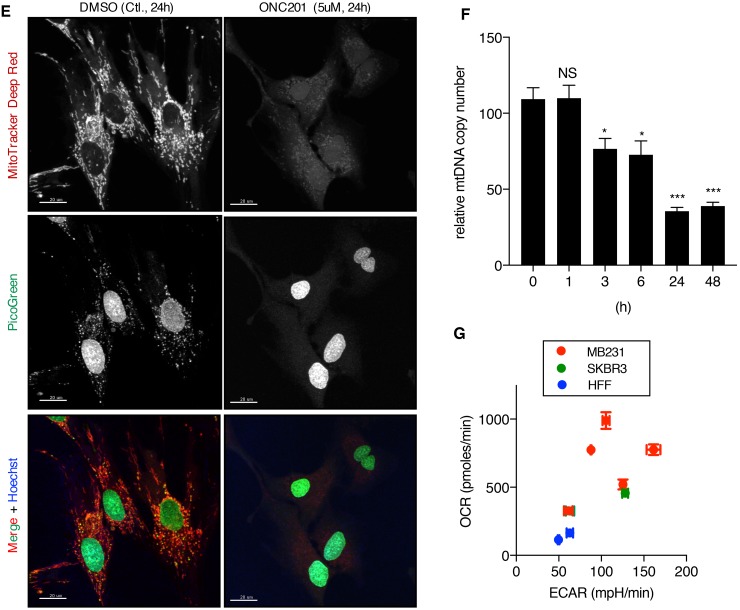
Figure 6. Human foreskin fibroblast cells are ONC201-resistant, despite mitochondrial damage and mtDNA depletion induced by ONC201.
(A) Cell viability assays comparing the effect of ONC201 between MB231 and HFF cells in glucose medium. Results are shown as mean +/− SEM of 3 independent experiments. (B) ATP assays comparing the effect of ONC201, oligomycin, and metformin between MB231 and HFF cells in glucose medium. Results are shown as mean +/− SEM of 3 independent experiments. In both A) and B) **p<0.01, ****p<0.0001, two-way ANOVA. (C) Cell viability assays (top) and ATP assays (bottom) of HFF cells treated with ONC201 and other mitochondrial targeting drugs in glucose or galactose containing medium. Results are shown as mean +/− SEM of multiple independent experiments. ****p<0.0001, two-way ANOVA. (D) TEM image of HFF cells treated with ONC201 (5μM) in glucose medium for indicated times. (E) Confocal microscopy image of HFF cells treated with DMSO (Ctl.) or ONC201 (5μM) for 24 h in glucose medium, and co-stained with MitoTracker Deep Red, PicoGreen and Hoechst. Scale bar = 20μm. (F) Quantitative analysis of mtDNA copy number in HFF cells treated with ONC201 5μM for indicated times in glucose medium. Results are shown as mean +/− SEM of 3 independent experiments. *p<0.05, ***p<0.001 (t-test vs. time zero). (G) XF analyzer results comparing basal level of OCR/ECAR of MB231, SKBR3 and HFF cells (in glucose medium). Cell density was 100% confluent on the day of OCR/ECAR measurement. Experiments were repeated multiple times. (MB231: n=5, SKBR3: n=2, HFF: n=2).


