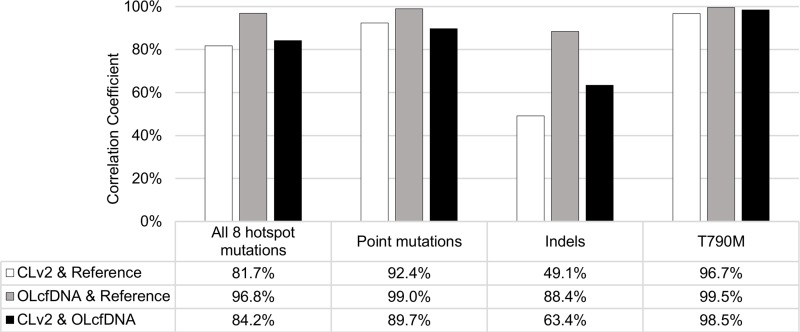
Figure 2. Correlation of expected and detected mutation allele frequencies of the reference samples for each panel (white and grey bars) and between both panels (Colon Lung version 2 (CLv2) and Oncomine Lung cfDNA (OLcfDNA), black bars); The correlation between the expected and detected allele frequencies of the reference samples was higher with OLcfDNA than with CLv2 panel.
Both assays achieved the highest correlation of expected and detected allele frequencies for EGFR T790M mutation (99.5% OLcfDNA vs. 96.7% CLv2) and the lowest for insertion/deletion (indel) (88.4% OLcfDAN vs. 49.1% CLv2) confirmation. Detected allele frequencies of both panels showed the highest correlation for T790M mutations (98.5%) and the lowest for indels (63.4%). Tested hotspot mutations: PIK3CA E545K, EGFR V769_D770insASV, EGFR E746_A750delELREA, EGFR T790M, EGFR L858R, KRAS G12D, NRAS Q61K, NRAS A59T.

