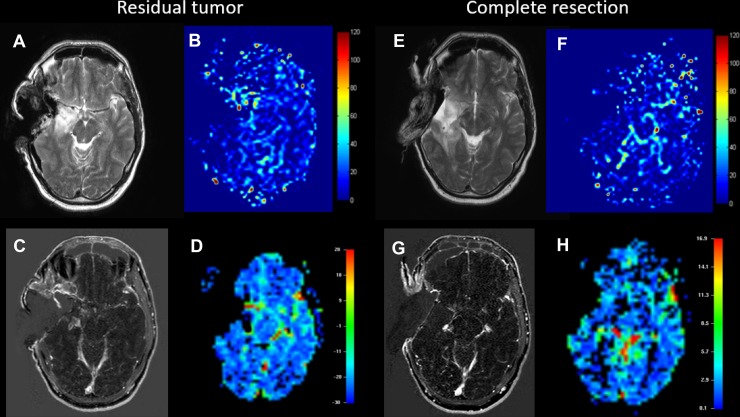
Figure 1.
Example of a patient with residual tumor (A–D) and a case of complete resection of the glioblastoma (E–H). A and E show T2-weighted images serving as anatomical reference for the ASL, which is shown in B and F (CBF is displayed in 100 ml/min/100 g tissue). C and G show contrast-enhanced T1-weighted images and finally D and H show negative integral maps of the DSC perfusion (Colormap in arbitrary units). All images were performed using the 1.5T intraoperative scanner.

