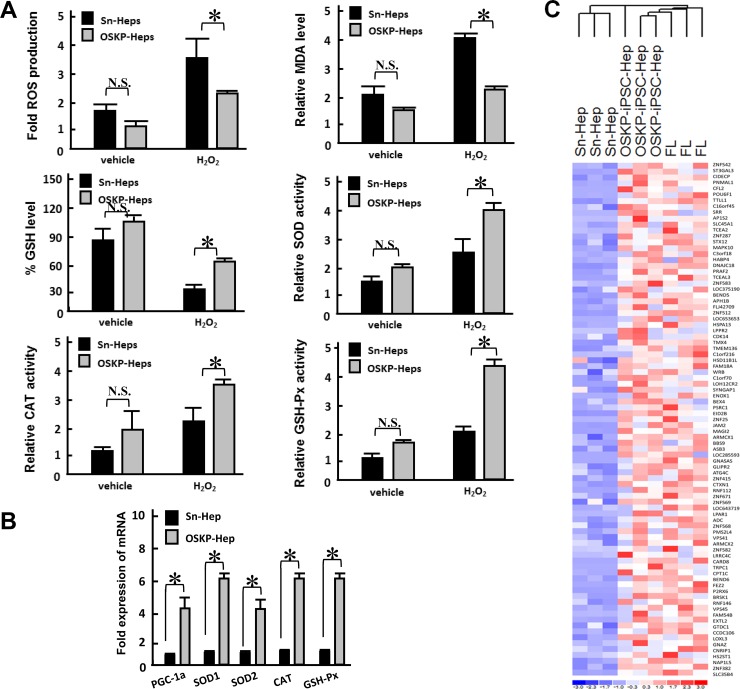
Figure 4.
Resistance of OSKP-iPSC-Heps to oxidative insults (A) Effect of H2O2 challenge on the production of ROS (Upper left), malondialdehyde (Upper right), glutathione (Middle left), and the enzyme activity of antioxidant enzymes SOD (Middle right) and CAT (Lower left) and GSH-Px (Lower right) in OSKP-iPSC-Heps and Sn-Heps. (B) Quantitative RT-PCR showing the expression of antioxidant genes PGC-1α, SOD1, SOD2, Catalase, and GSH-Px in OSKP-iPSC-Heps and Sn-Heps. (C) Gene expression microarray analysis showing the expression profile among OSKP-iPSC-Heps, Sn-Heps and fetal livers. The predominant upregulated processes in OSKP-iPSC-Heps included those related to the antioxidant enzyme system. In Panels A and B, *P < 0.05 vs. Sn-Heps.

