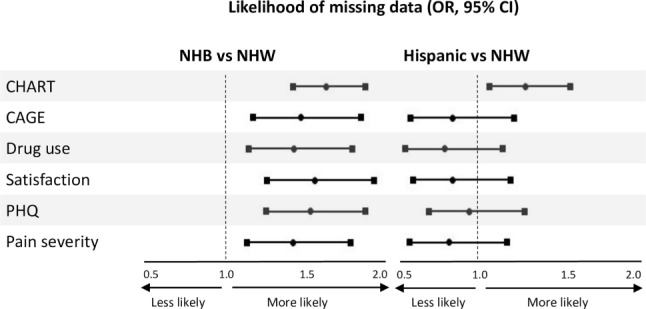
Figure 2.

Racial differences in the likelihood of missing data for self-reported outcome measures in the National Spinal Cord Injury Database. Adjusted odds ratios (OR; circles) and 95% confidence intervals (CI, squares) of missing data in outcome measures captured for non-Hispanic black (NHB) participants (left) and Hispanic participants (right) versus non-Hispanic white (NHW) participants. CHART = Craig Handicap Assessment and Reporting Technique; CAGE = CAGE questionnaire for alcohol problems; SWLS = Diener's Satisfaction with Life Scale; PHQ = Patient Health Questionnaire.
