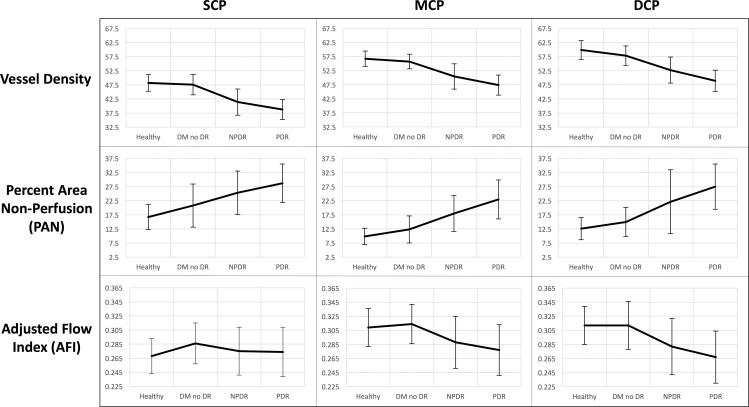
Figure 4.
OCTA parameters across disease groups graphed continuously. Columns from left to right: SCP, MCP, and DCP. Rows from top to bottom: mean values for parafoveal vessel density, PAN, and AFI, respectively, graphically represented across healthy controls, eyes with DM without DR, NPDR, and PDR. Error bars: 1 SD.

