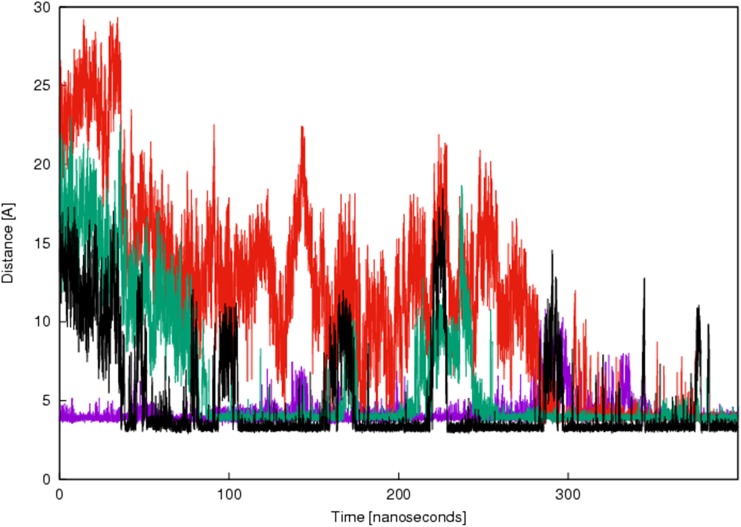
Figure 6. Time-resolved changes in the distances between the selected opposite charged amino acids in Nb206 and EF-TU/TUFM.
Violet, R100 and E253; red, R107 and D260; green, D104 and R273; black, D98 and K257. X axis shows time from the equilibration of the complex formed between Nb206 and EF-TU. Y axis shows distance between the selected opposite charged amino acids in Nb206 and EF-TU in angstrom (Å).

