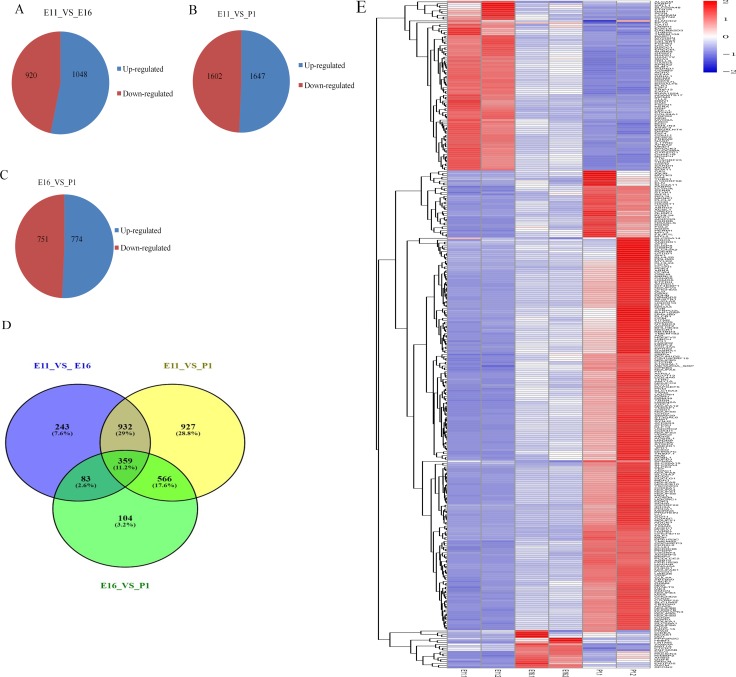
Figure 4. Differentially expressed mRNAs in each contrast group.
(A–C) Differentially expressed mRNA up and down regulated with absolute value (log2 fold change ≥ 1) in three contrast group. (D) Venn diagram shows differentially expressed mRNA with P < 0.0059. (E) Heat map of common up and down regulated differentially expressed mRNA in three contrast group. Interaction networks of differentially expressed miRNAs and genes in each contrast group.

