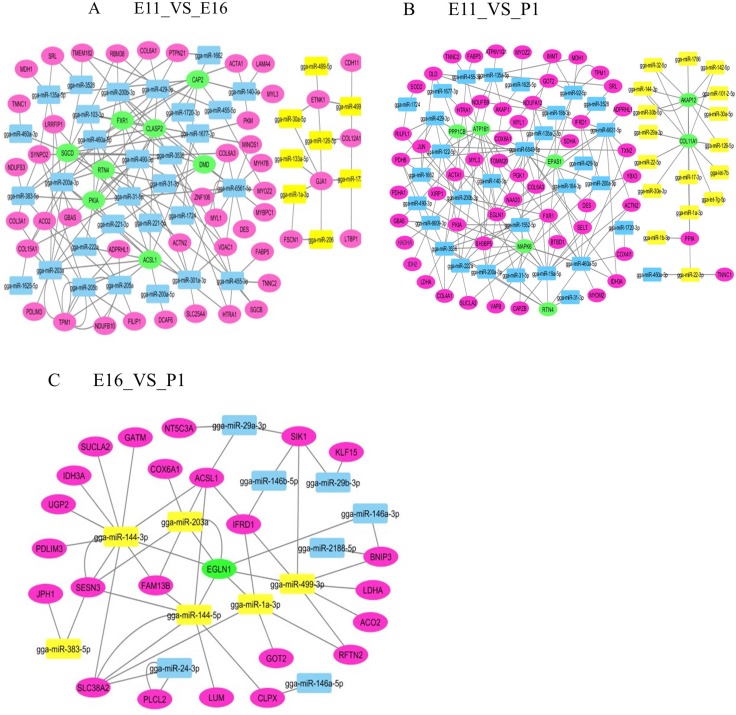
Figure 5. Interaction networks of differentially expressed miRNAs and genes in each contrast group.
(A) E11_VS_E16 (B) E11_VS_P1 (C) E16_VS_P1. Green ellipse; interaction with more than six miRNAs. Purple ellipse; interaction with less than five miRNAs. Yellow square; up regulated miRNA. Blue square; down regulated miRNA.

