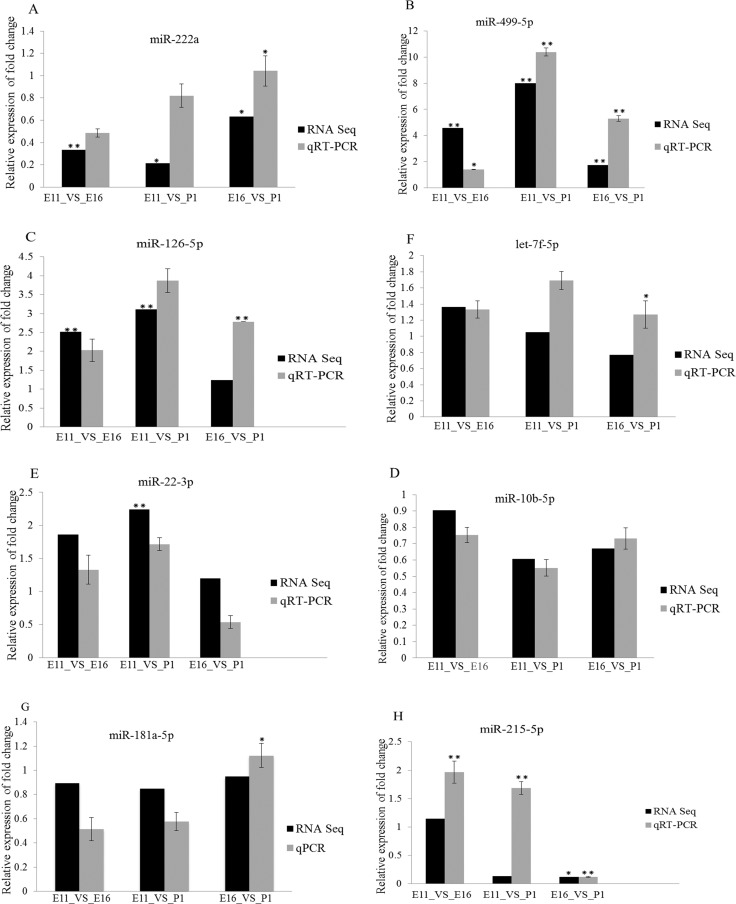
Figure 6. RT-qPCR validation of eight differentially expressed miRNAs in three comparisons, E11_VS_E16, E11_VS_P1 and E16_VS_P1.
(A–H) The vertical axis is represented relative fold change expression of miRNAs and the horizontal axis indicated contrast groups. The numerical data are shown as means ± S.E.M. of at least three replicates. The asterisks denotes **P < 0.01 and *P < 0.05.

