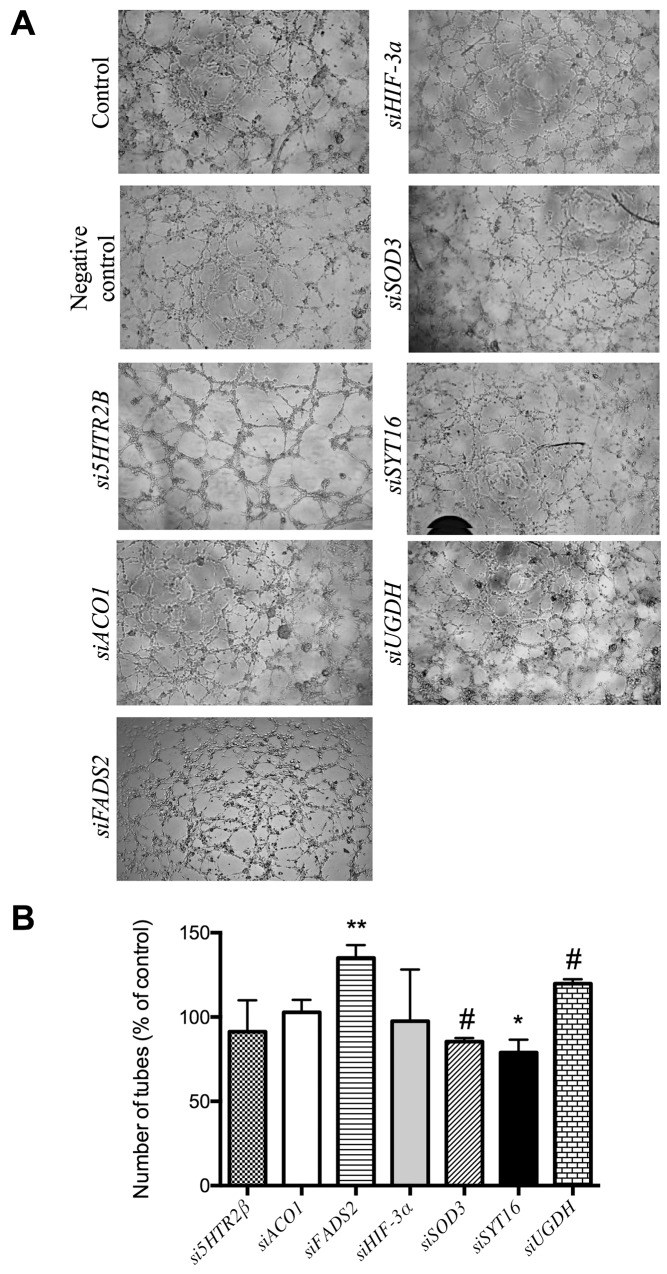
Figure 4. Formation of “tubule-like” structures of endothelial cells on Matrigel.
(A) Representative photographs of control and gene-silencing treated cells on Matrigel after 5 h. (B) Quantitative analysis of data. Data represent the means ± SD of three independent experiments. Symbols indicate significant differences between control and treated cells (*p <0.05, **p<0.01, #p < 0.005).

