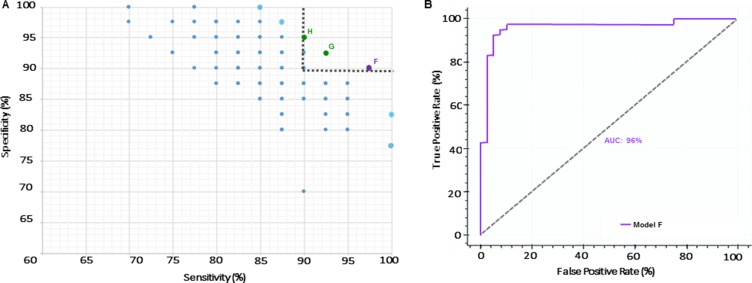
Figure 2. Inclusion of α-syn as a variable improves performance of a miRNA-panel.
(A) Pareto Efficiency of models including miRNAs and α-syn. Gray dashed line represents threshold used to select models with over 90% sensitivity and specificity. Purple dot represents the selected model (Model F) with 97% sensitivity and 90% specificity. Green dots represent Models G and H. (B) ROC curve of selected Model F with AUC of 96%.

