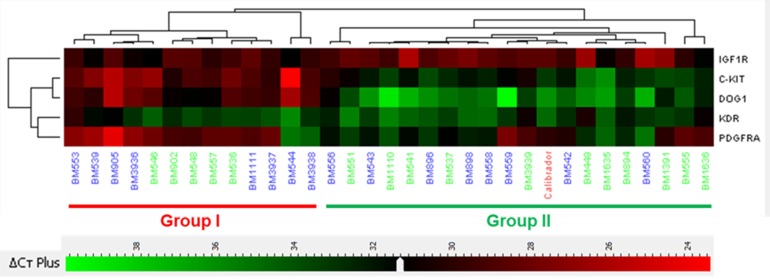
Figure 1. Clustering analyses according to RNA level expression.
Group I (13 cases) is characterized by an overexpression of KIT, DOG1 and PDGFRA, and underexpression of IGF1R. Group II (19 cases) is characterized by an overexpression of IGF1R. In this group KIT, DOG1 and PDGFRA are clearly underexpressed. KDR expression was similar between both groups. Numbers in green indicate wild type genotype.

