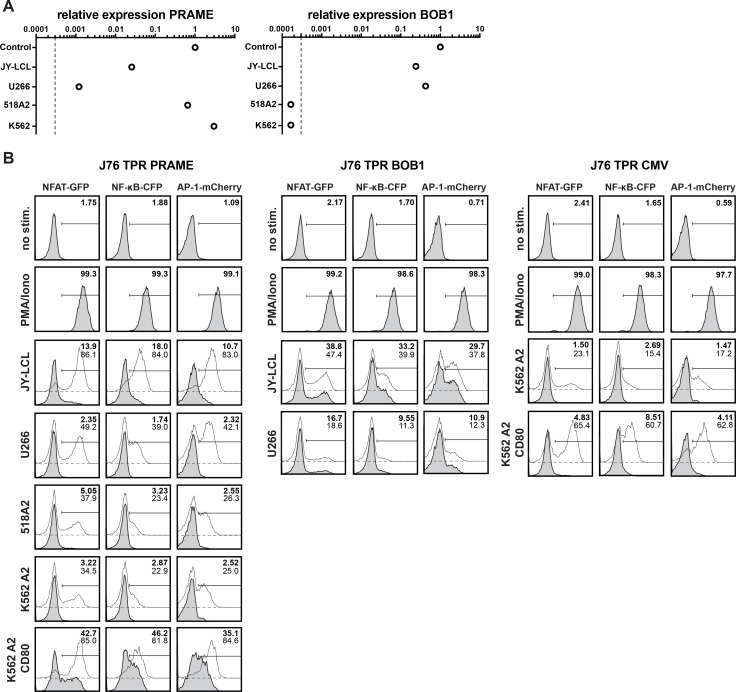
Figure 2. Functional evaluation of the antigen-specific J76 TPR.
(A) Expression of PRAME and BOB1 mRNA in different cell lines as quantified by qPCR. The dashed line indicates the detection limit. (B) Different tumor and melanoma cell lines were used as antigen presenting cells to stimulate J76 TPR PRAME (left), BOB1 (middle) or and CMV (right). In addition to analysis of endogenous peptide presentation (grey histograms), 1 uM of antigenic peptides was added to the cocultures (open histograms). Numbers show the percentage of positive cells of unloaded (bold) or peptide loaded (thin) assay conditions. Depicted histograms are representative for three independently performed experiments.

