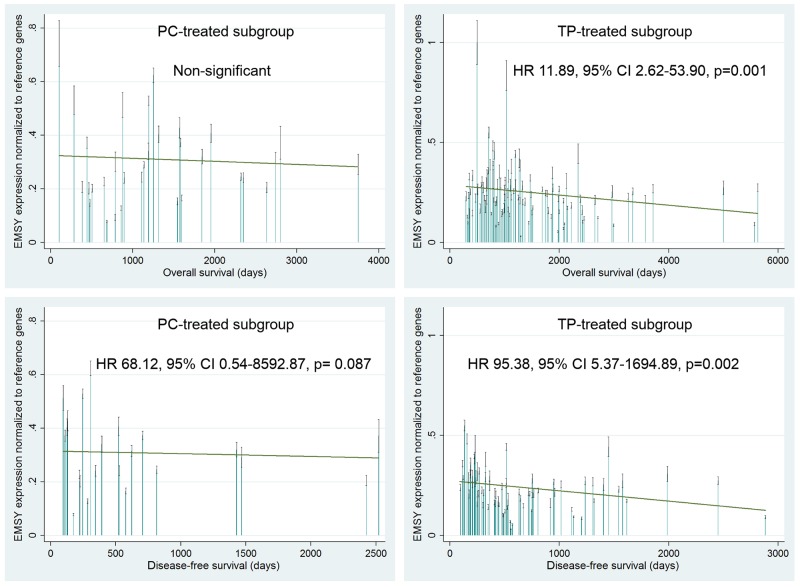
Figure 4. Evaluation of a prognostic value of the EMSY gene expression in the PC- and TP-treated subgroups of ovarian cancer patients.
A multivariate statistical analysis was performed using the Cox proportional hazards model. Green linear regression lines visualize trends in the expression change. Non-significant – a result with a p-value ≥0.1.

