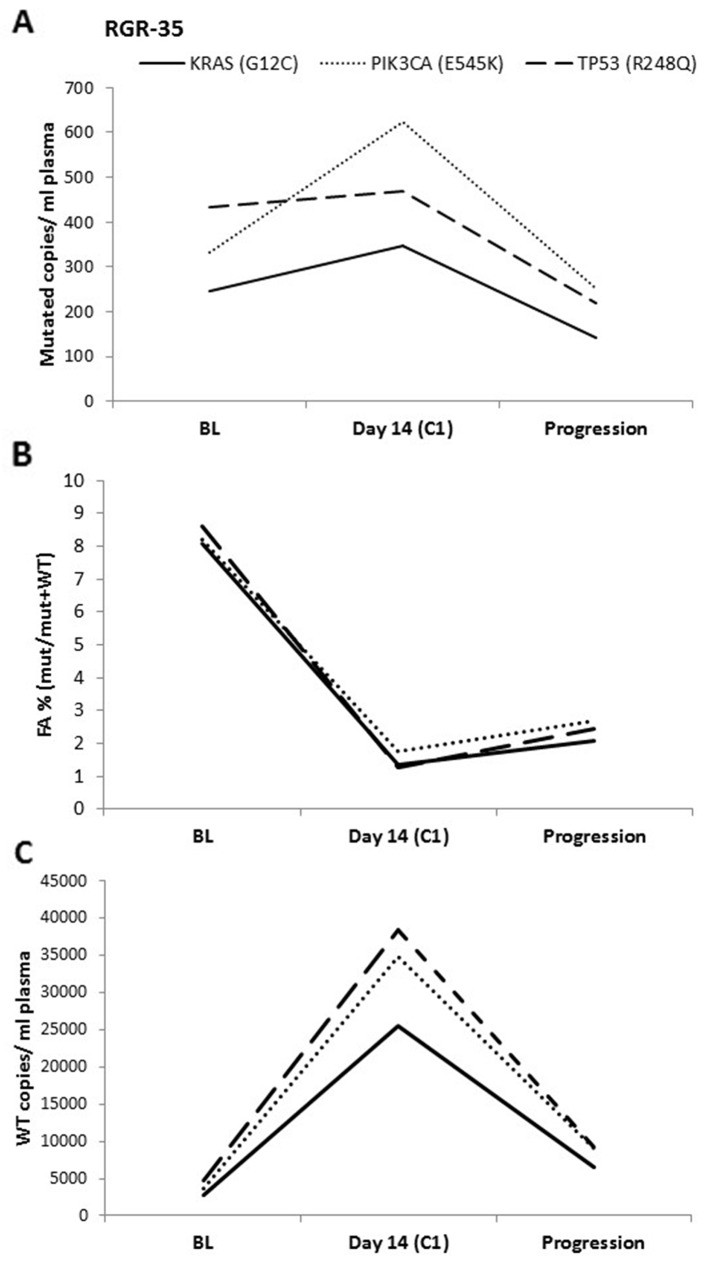
Figure 3. ddPCR data analysis.
The ddPCR results for one patient expressed as (A) mutated copies/ mL of plasma, (B) FA (mutated copies/wild-type copies + mutated copies) and as (C) Wild-type copies/ mL of plasma. In (A), an increase is seen in mutated copies/ mL between baseline (BL) and at day 14 of cycle 1 (C1). In contrast, a clear decrease is observed when using the FA. This difference can be explained by the 8-fold increase in WT copies between BL and C1.

