
Figure 4. ctDNA and cfDNA status before and during regorafenib treatment.
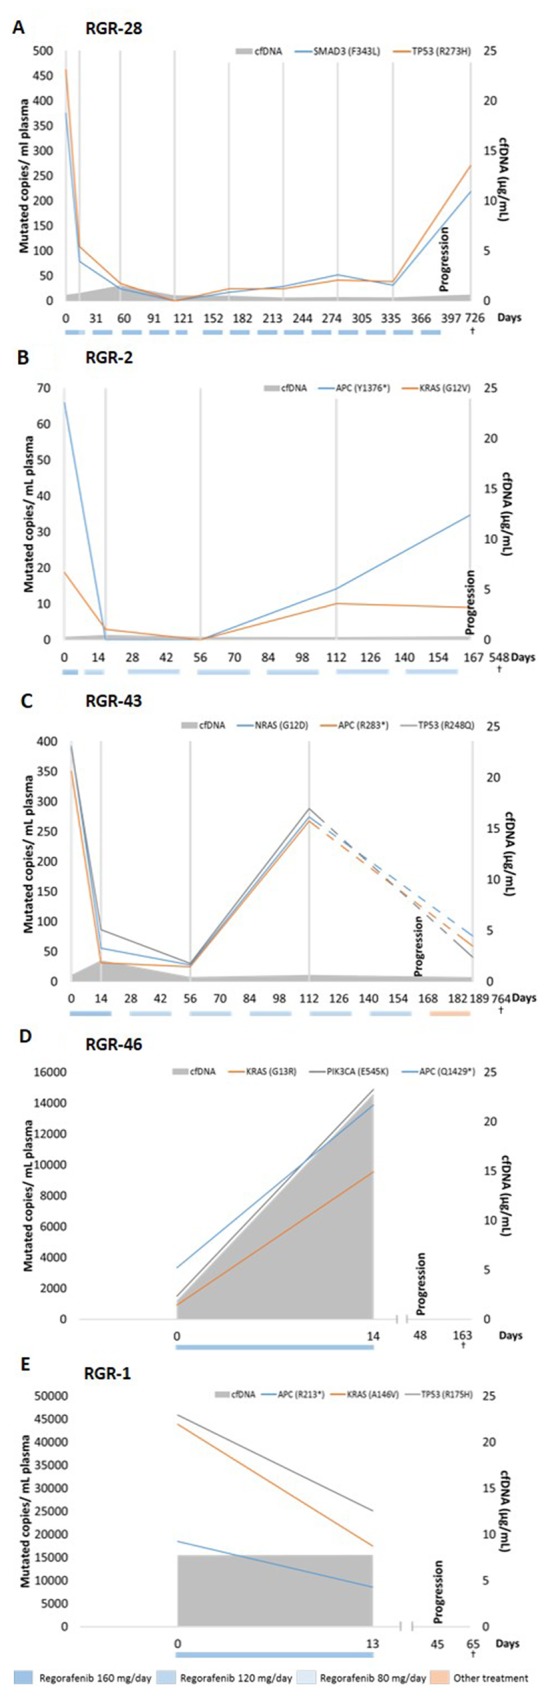
ctDNA concentrations and cfDNA for 5 patients that received regorafenib therapy. Colored boxes below the graphs indicate the dose and the period during which treatment was administered. Grey vertical lines indicate the time-points of ctDNA analysis. Patient (A) shows an immediate drop (4-fold) in ctDNA levels at day 14. A 6-fold increase is detected at progression. The patient denoted in (B) also shows an immediate decrease in ctDNA at day 14 and a significant increase in ctDNA at least 48 days before clinical disease progression. Interestingly, both represented mutations behave differently upon disease progression. (C) After an immediate drop in ctDNA, an increase is detected at least 56 days before clinical progression. Interestingly, 6 days after progression this patient received FOLFOX therapy explaining the drop (dashed lines) in ctDNA levels between 2 ctDNA measurements surrounding the time-point of progression. In contrast, the patient in (D) showed a 4-fold increase in ctDNA for all clones immediately after starting the regorafenib treatment. The patient progressed clinically 48 days after the start of treatment. In parallel, a 12-fold increase is measured in total cfDNA between baseline and 14 days after the start of treatment. Patient RGR-1 in (E) shows a high cfDNA level at baseline of 23.2μg/mL. In contrast, all measured mutations in ctDNA decrease between baseline and day 14 after start of regorafenib therapy. The colored boxes below the graphs indicate the dose and the period during which the treatment was administered.