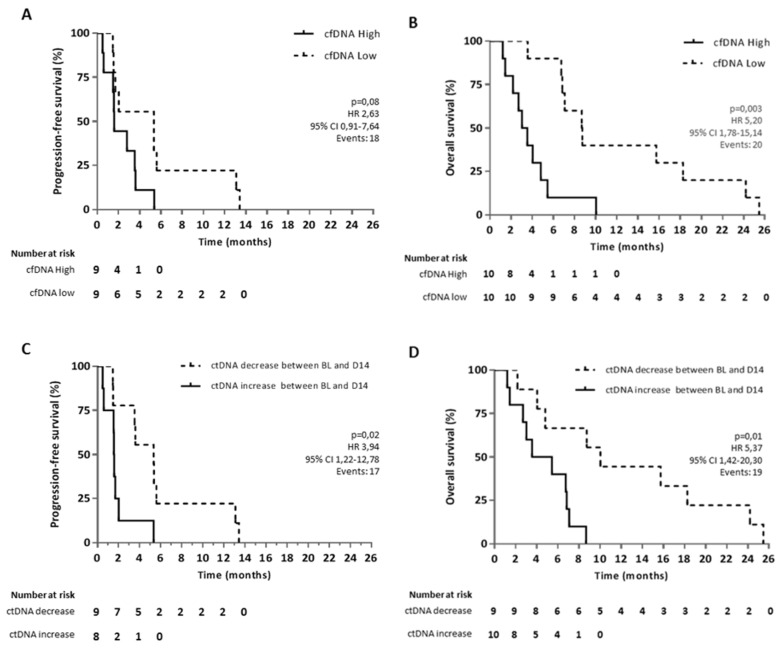
Figure 5. Kaplan-Meier curves for OS and PFS in aCRC patients receiving regorafenib therapy.
Survival curves are represented according to the level of (A, B) cfDNA in plasma at baseline for OS and PFS, respectively and according to (C, D) the increase or decrease of ctDNA levels between baseline (BL) and 14 days after the start of regorafenib therapy (D14). Two patients out of 20 were not included in the PFS analysis due to missing information on clinical progression. For ctDNA analysis, another patient was excluded due to a poor quality blood sample at C1.

