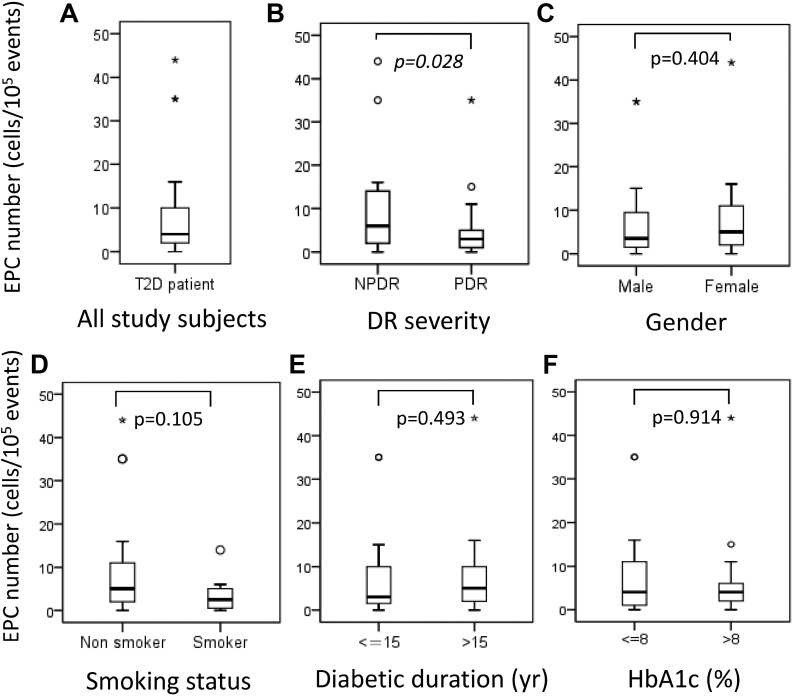
Figure 1.
(A) Number of endothelial progenitor cells (EPCs) in all study subjects, and number of EPCs stratified by (B) diabetic retinopathy severity, (C) sex, (D) smoking status, (E) diabetic duration ≤ 15 years versus > 15 years, and (F) hemoglobin A1C level ≤ 8% versus 8%. Asterisks and circles in the plot represent the extreme outlier values and outlier values, as defined by the box blot, respectively.

