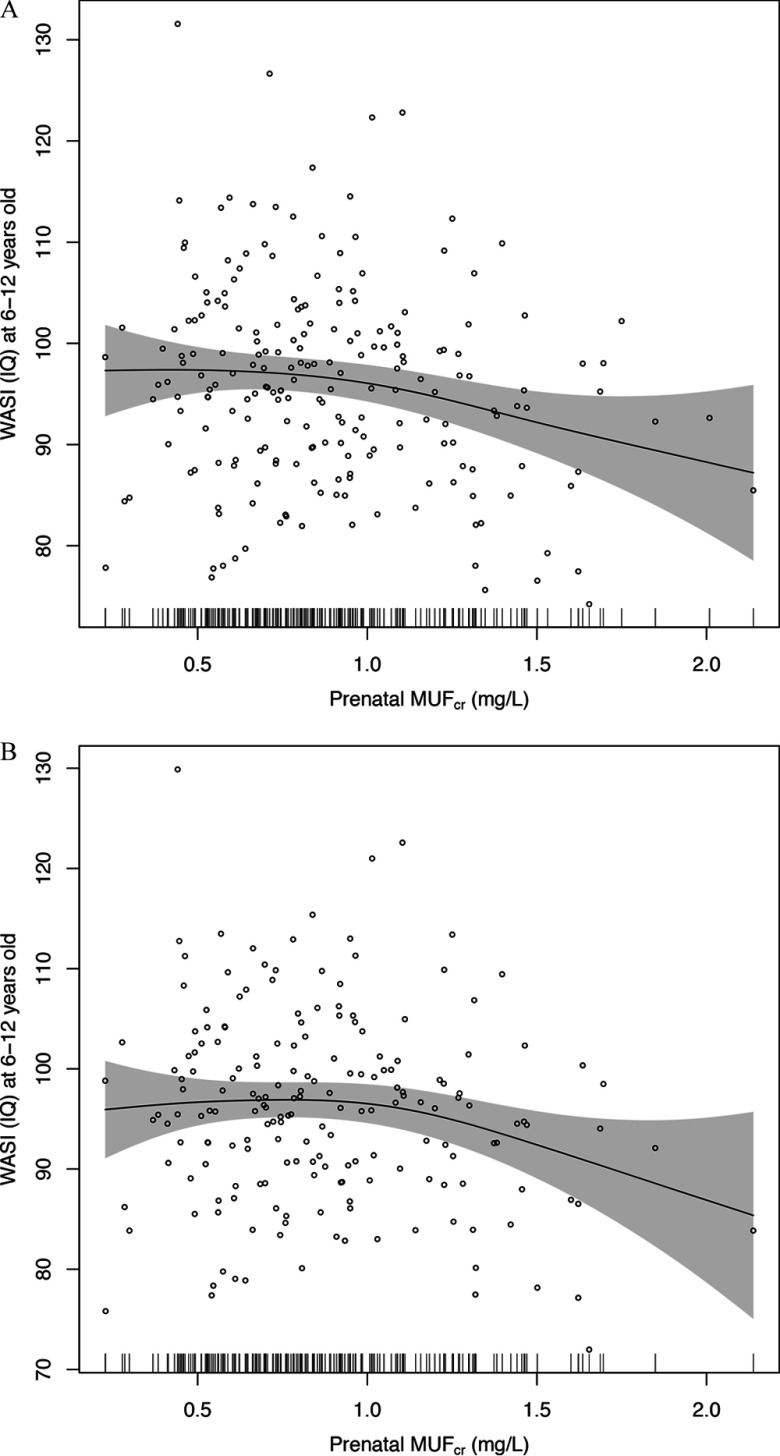
Figure 3.
(A) Adjusted association of maternal creatinine-adjusted urinary fluoride () and children’s IQ at age 6–12 y. Adjusted for gestational age, weight at birth, sex, parity (being the first child), age at outcome measurement, and maternal characteristics including smoking history (ever smoked vs. nonsmoker), marital status (married vs. others), age at delivery, IQ, education, and cohort (Cohort 3-Ca, Cohort 3-placebo and Cohort 2A). Short vertical bars on the x-axis reflect the density of the urinary fluoride measures. Individual data points are individual observation, . (B) Association of maternal creatinine-adjusted urinary fluoride () and children’s IQ at age 6–12 y, adjusted for specific gravity–adjusted child urinary fluoride (). Adjusted for gestational age, weight at birth, sex, parity (being the first child), age and at outcome measurement, and maternal characteristics including smoking history (ever smoked vs. nonsmoker), marital status (married vs. others), age at delivery, IQ, education. and cohort (Cohort 3-Ca, Cohort 3-placebo and Cohort 2A). Shaded area is 95% confidence interval. Short vertical bars on the x-axis reflect the density of the urinary fluoride measures. Individual data points are individual observation, .

