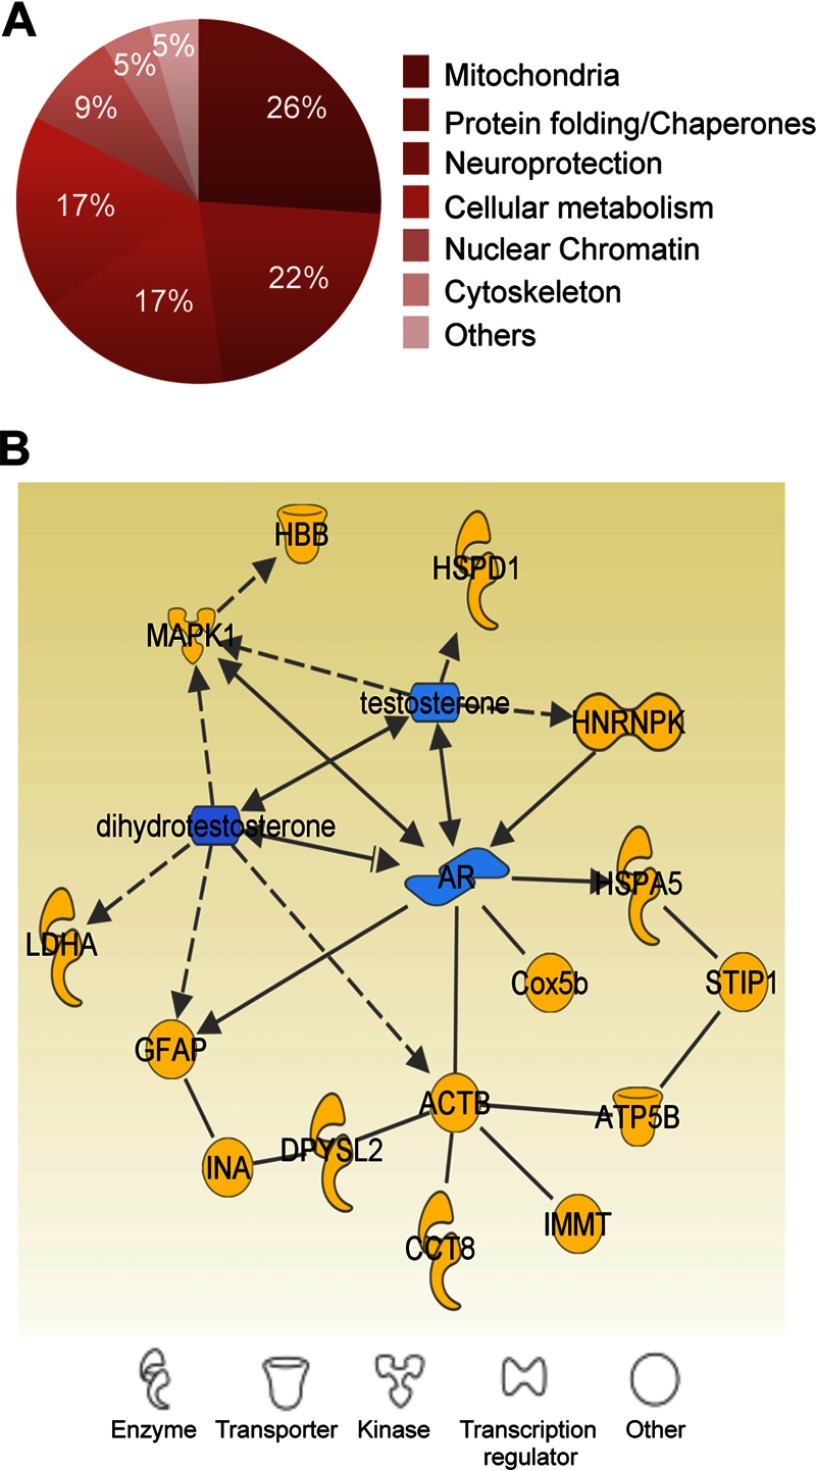
Figure 5.
Proteome analysis of the medial preoptic nucleus (MPN) in di(2-ethylhexyl) phthalate (DEHP)–exposed males. (A) Classification of differentially expressed proteins between the exposed groups into six major categories based on cellular localization and function. The percentages of proteins in each category are indicated. (B) Androgen-related protein interaction network generated by Ingenuity Pathway Analysis.

