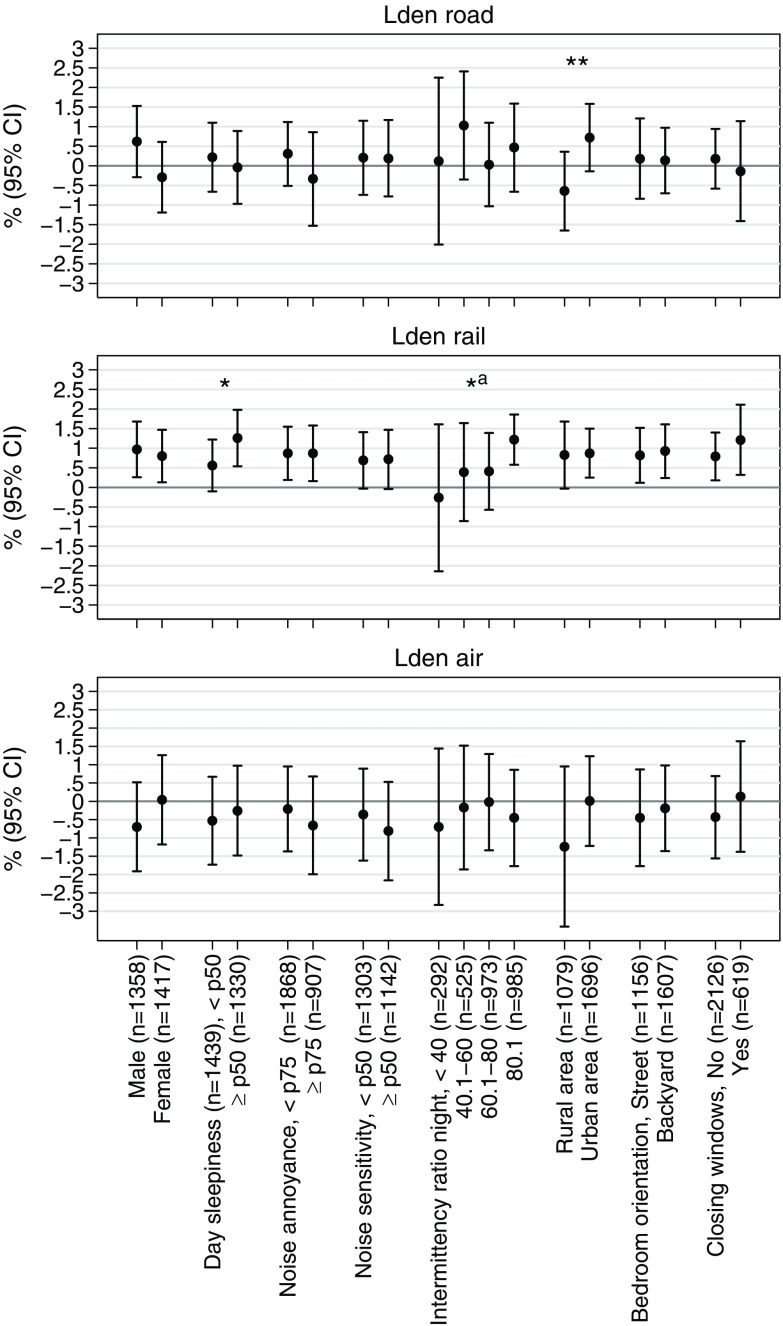
Figure 1.
Association between annual average source-specific noise levels (Lden) and arterial stiffness (baPWV) across different subgroups, per interquartile range (IQR) change of the respective noise indicator (road: 10.6 dB, railway: 8.1 dB, aircraft: 8 dB). Multiexposure linear mixed models included an interaction term between Lden and the corresponding subgroup and were adjusted for sex, age, , education, smoking status, pack-years smoked, secondary smoke, alcohol consumption, diet, body mass index (BMI), , physical activity, mean arterial pressure (MAP), , nitrogen dioxide, all source-specific Lden levels and their noise truncation indicators, and a random intercept by study area. **p-value of interaction , *p-value of interaction . ap-value for , p-value of interaction .

