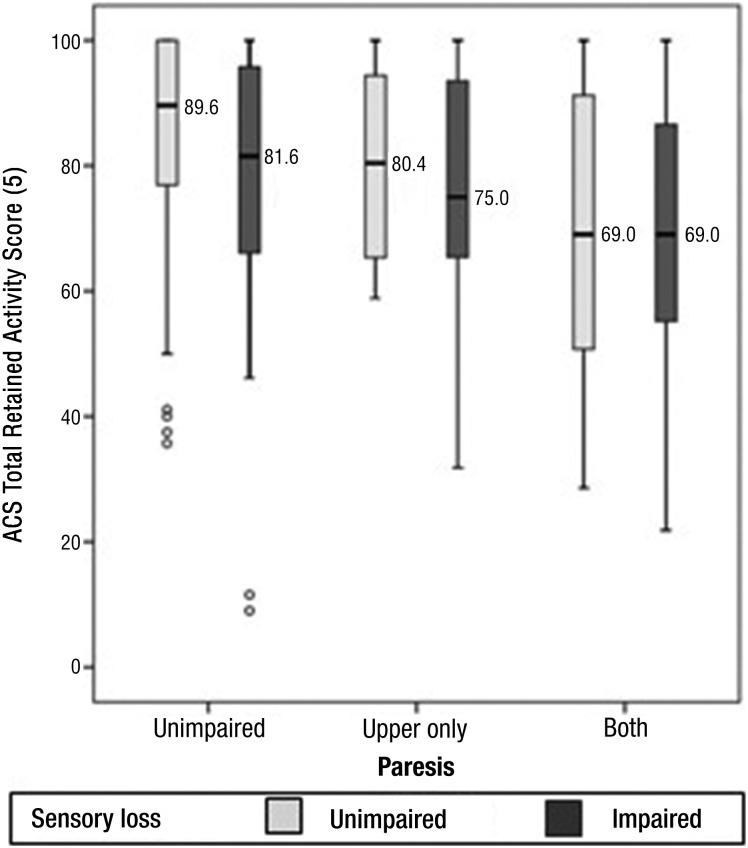
Figure 1.
Box plots showing overall percentage of retained activity scores poststroke as measured by the Activity Card Sort (ACS) in six groups of stroke survivors classified according to somatosensory impairment and paresis.
Boxes indicate the 25th and 75th percentiles (i.e., the interquartile range [IQR]). The median (50th percentile) is represented by a line across and within the box. The whiskers extend from the upper and lower edges of the box to the highest and lowest values that are not greater than 1.5 times the IQR above or below the box limits. Outliers, represented by open circles, locate cases with values that deviate more than 1.5 times the IQR above or below the box limits.

