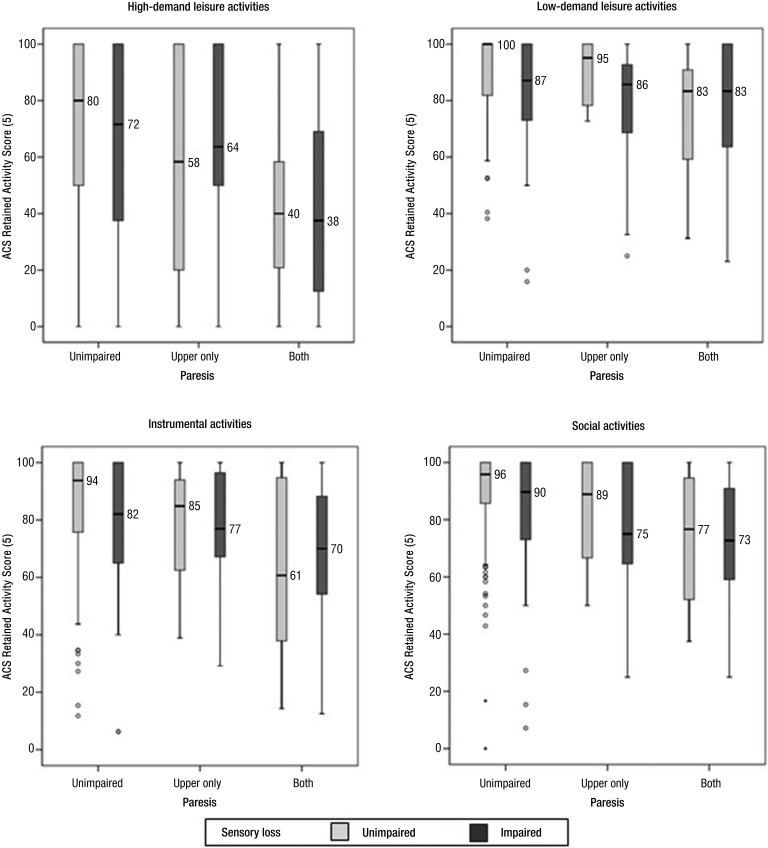
Figure 2.
Box plots illustrating distributions of percentage of retained activity scores of the Activity Card Sort (ACS) domains.
Light gray bars represent groups without somatosensory loss; dark gray bars indicate groups with sensory loss. Median values are rounded to the nearest integer value. Outliers, represented by open circles, indicate cases with values that deviate from the median by more than 1.5 to 3 times the IQR. Extreme outliers (values >3 times the IQR) are indicated by solid circles.

