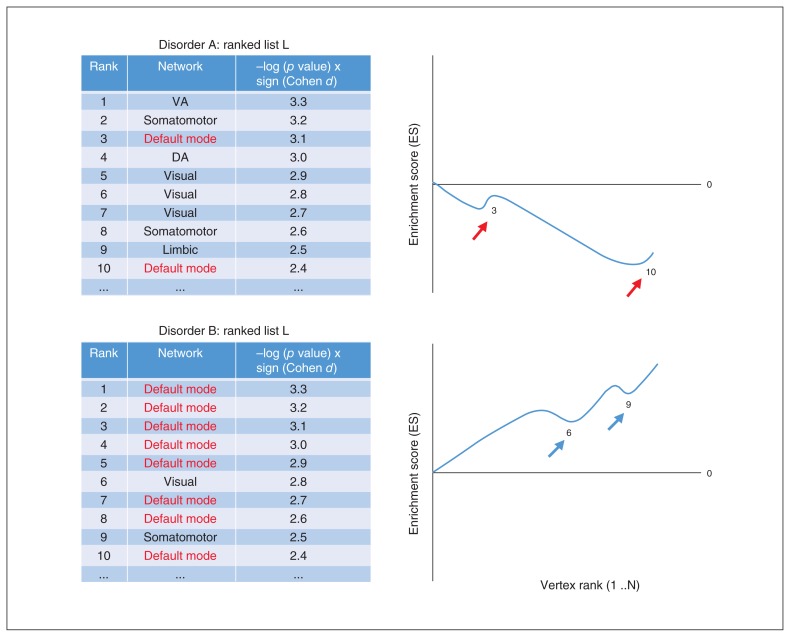
Fig. 1.
Graphical representation of network-set enrichment analysis (NSEA) using 2 hypothetical disorders and corresponding arrays. In both disorders, vertices are ordered using the ranking metric described: −log(p value) × sign(Cohen d), derived from case–control meta-analysis statistics within each disorder. Examining the enrichment score (ES) curves of the default mode network across Disorders A and B: A shows an initially decreasing ES due to default mode network vertices lacking enrichment (clustering) near the top of the ranked list, whereas B shows increasing ES due to highly enriched arrangement in ranked list L near the top.

