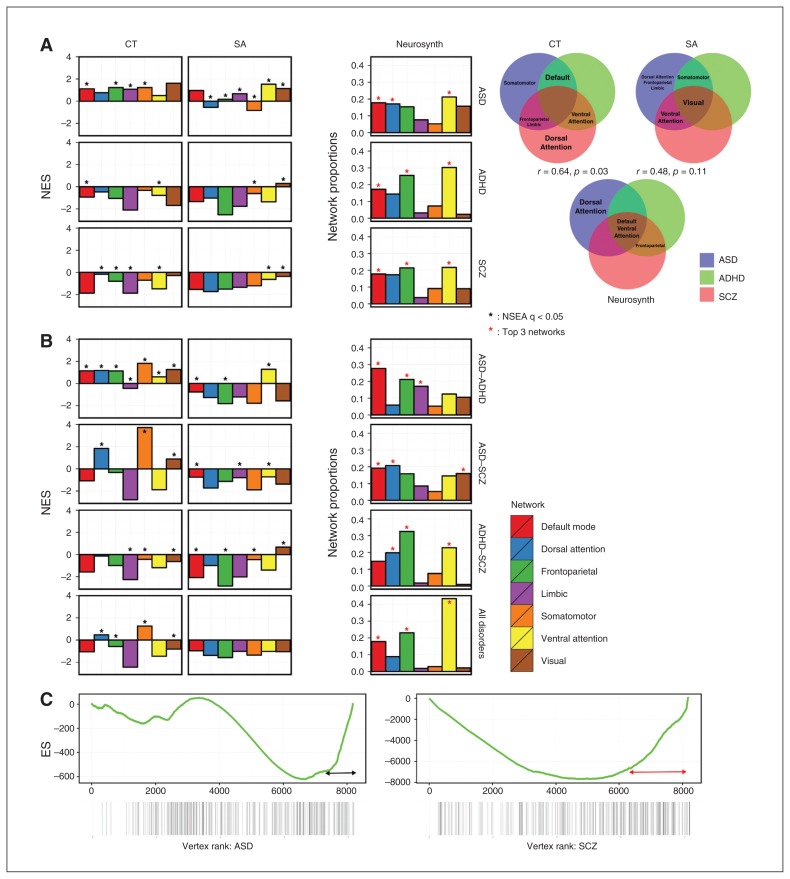
Fig. 4.
Assessing cross-modal homology comparing structural MRI to Neurosynth functional MRI (fMRI) findings at the network level. (A) Network-set enrichment analysis (NSEA) applied to single-disorder analyses for cortical thickness (CT) and surface area (SA), with Neurosynth comparisons. The Y axis indicates the normalized enrichment score (NES) for all meta-analysis results. Venn diagrams show networks that were significantly enriched across disorders. Correlations of Venn diagrams between CT and Neurosynth was significant (r = 0.64, p = 0.032), whereas the correlation between SA and Neurosynth was not significant (r = −0.48, p = 0.11). (B) The NSEA applied to combined disorder analyses and was compared with Neurosynth results. (C) Examining the dorsal attention SA network ES curves between patients with autism-spectrum disorder (ASD) and schizophrenia (SCZ). The Y axis indicates ES, and the X axis indicates ranked vertices from both hemispheres.

