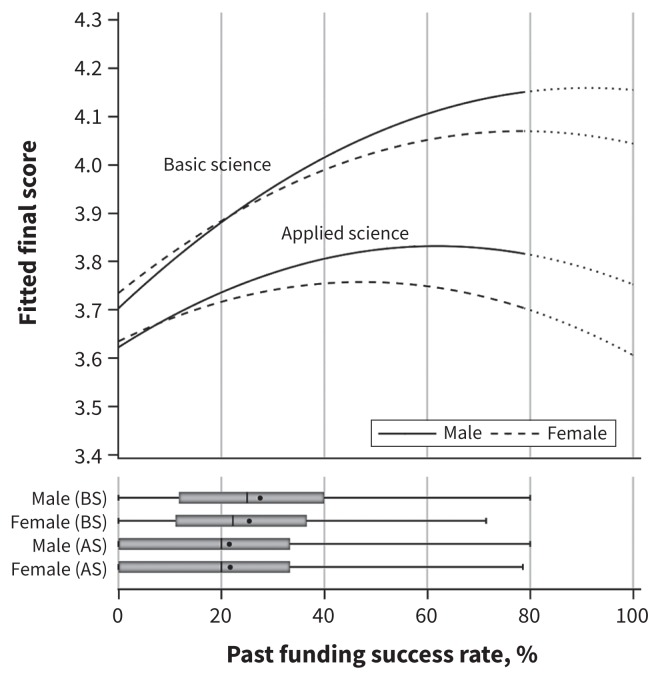
Figure 1:
Fitted final scores of male and female applications in the domains of basic science (BS) and applied science (AS) in relation to past funding success rate based on the final model (Table 4). These graphs were generated using the reference category of all categorical variables in the final model, and the mean value for the continuous variables (mean number of investigators = 2, mean total amount of funding requested = $750 000, mean number of funded applications for the reviewers = 30%). For each of the subgroups, the h-index value was taken as the mean value within the specific group: biomedical sciences male = 7.9, biomedical sciences female = 6.3, applied sciences male = 7.9, applied sciences female = 5.5.

