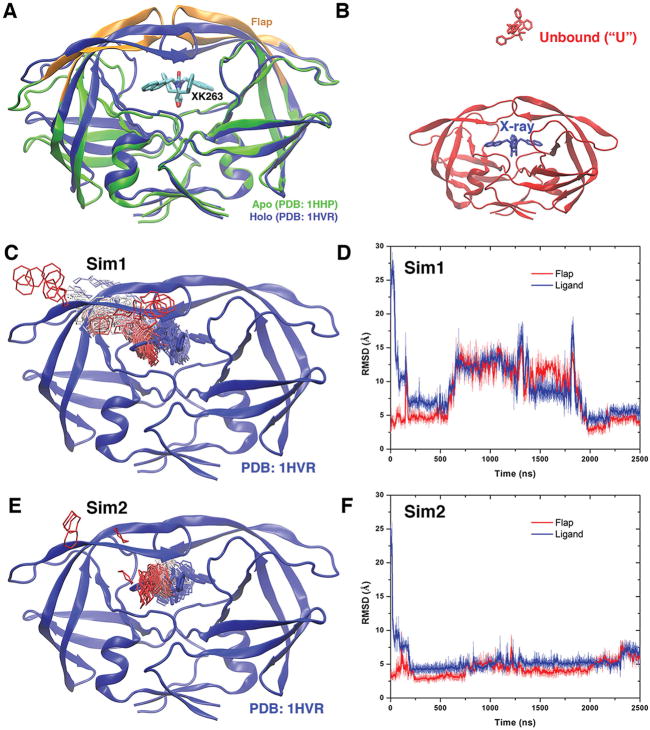
Figure 1.
(A) X-ray crystal structures of the HIV protease in the apo form (Protein Data Bank entry 1HHP, green) and holo form that is bound by the XK263 ligand molecule (Protein Data Bank entry 1HVR, blue). The ligand is shown as sticks and the protein as ribbons. Protein residues Lys43–Tyr59 in the flaps of two protein monomers are colored orange. (B) Simulation starting structure of the HIV protease in which the ligand molecule (red sticks) is placed ~20 Å from the protein surface in the unbound (“U”) state. A virtual ligand molecule of the X-ray conformation is colored blue for reference. (C) During the “Sim1” GaMD trajectory, the XK263 ligand molecule binds to the active site of the HIV protease within 2500 ns, for which the center ring of XK263 is represented by lines and colored by simulation time in a red–white–blue (RWB) color scale. The 1HVR X-ray conformation is colored blue for reference. (D) Root-mean-square deviations (RMSDs) of the ligand molecule and protein flaps relative to the 1HVR X-ray conformation are plotted for “Sim1”. Thick lines depict the running average over 5 ns time windows. (E and F) Ligand binding pathway and ligand and flap RMSDs obtained from the “Sim2” GaMD trajectory, respectively. Ligand pathways and RMSDs of the ligand molecule and protein flaps are presented in Figure S1 for the other eight GaMD simulations, during which the ligand minimum RMSD is >3 Å (Table 1).

