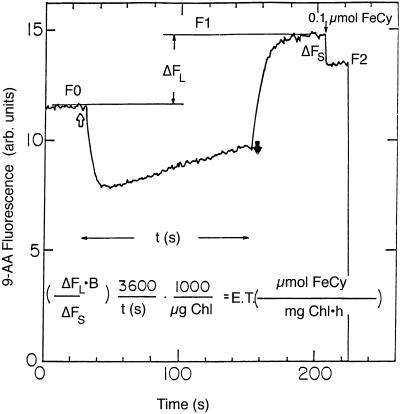
Figure 2.
The increase in 9-AA fluorescence as a measure for FeCy reduction. 9-AA fluorescence was monitored in a spectrofluorimeter (SLM 8000c, Aminco). F0, Initial 9-AA fluorescence; F1, 9-AA fluorescence after illumination; F2, 9-AA fluorescence after addition of FeCy. ΔFL is the relative increase in 9-AA fluorescence during illumination (ΔFL = 1 − F0/F1), ΔFS is the decrease in 9-AA fluorescence due to a standard addition of FeCy (ΔFS = 1 − F2/F1), t is the illumination time in seconds, and B is μmol of FeCy added as standard. The equation gives the conversion of ΔFL into the rate of FeCy reduction, in units of μmol of FeCy reduced mg−1 Chl h−1. In this case 0.1 μmol of FeCy was added as standard.

