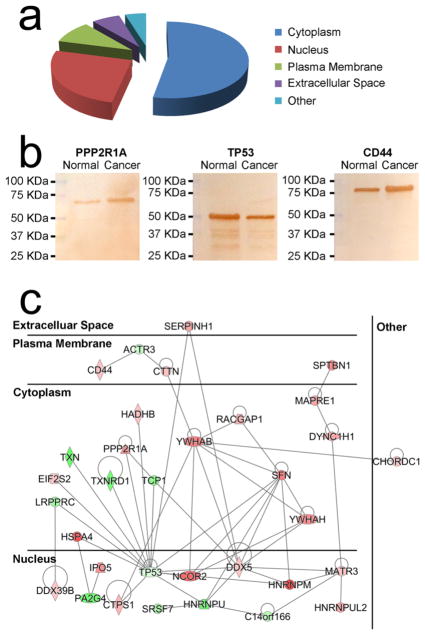
Figure 5.
Western blot verification and subcellular and functional analysis of differentially expressed proteins between CMTCs and HMTCs. Among 4102 quantified proteins, 62 proteins had GO information. (a) The subcellular distribution shows that proteins from cytoplasm, nucleus, plasma membrane, and extracellular space account for 53.23, 25.81, 9.68, and 6.45%, respectively. (b) Western blot verified the quantification results of CD44, TP53, and PPP2R1A by mass spectrometry. (c) The IPA analysis shows that 31 proteins have direct interactions. Red and green represent up- and down-regulation in CMTCs, respectively.

