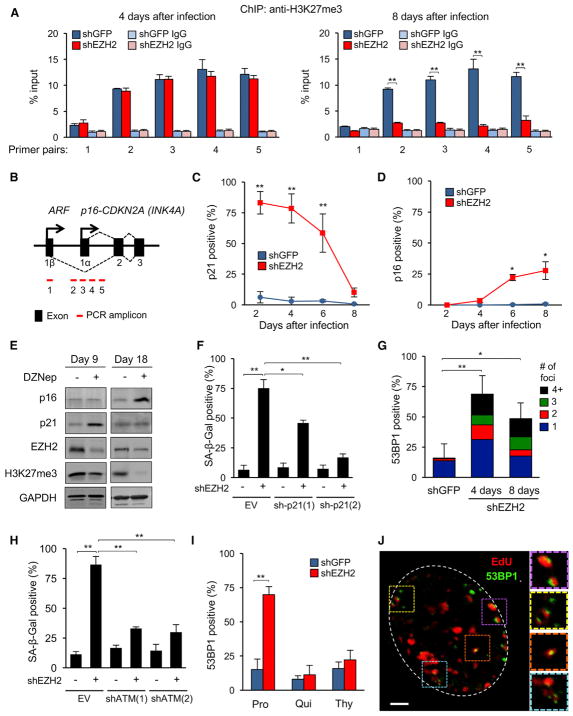
Figure 2. Downregulation of EZH2 Induces DNA Damage and Senescence in a DNA Replication-Dependent Manner.
(A) H3K27me3 enrichment at the CDKN2A locus was determined 4 and 8 days after shEZH2 infection using ChIP. For locations of primer pairs, see (B). Normal rabbit immunoglobulin G (IgG) was used as the immunoprecipitation (IP) control (**p < 0.01, n = 3).
(B) Schematic of the CDKN2A locus.
(C) The frequency of p21-expressing cells was scored by IF after knockdown of EZH2 (percent of total cells, random fields, more than 400 cells per condition, **p < 0.01).
(D) The frequency of p16-expressing cells was determined as in (C) (*p < 0.05).
(E) Early passage LF1 cells were grown in the presence of DZNep (5 μM), and the levels of p16, p21, and EZH2 proteins and H3K27me3 marks were examined by immunoblotting after 9 and 18 days of treatment.
(F) p21 shRNAs or the empty vector were combined with an EZH2 shRNA (+) or a shGFP control (−), and SA-β-Gal-positive cells were scored 4 days after infection (*p < 0.05, **p < 0.01, n = 3).
(G) 53BP1 foci were visualized by IF 4 and 8 days after EZH2 knockdown. The stacked bars depict the fraction of cells with 1 focus (blue) or 2 (red), 3 (green), and more than 4 (black) foci per nucleus (**p < 0.01, n = 4).
(H) shATM and shEZH2 knockdowns were combined, and SA-β-Gal-positive cells were scored as in (F) (**p < 0.01, n = 3).
(I) At the time of shEZH2 infection (time [t] = 0; Figure S1G), cells were reseeded into either normal medium (Pro, 15% FBS), quiescence-inducing medium (Qui, 0.25% FBS), or medium supplemented with thymidine (Thy). 53BP1 foci were scored after 4 days (**p < 0.01, n = 3).
(J) EZH2 was knocked down as in (A), and cells were pulse-labeled with EdU for 1 hr 2 days after infection. A representative image showing colocalization of EdU (red) and 53BP1 (green) signals is shown. Right: magnified views of the indicated areas. Scale bar, 3 μm.
Error bars represent SD. See also Figures S3 and S4 and Tables S1 and S2.

