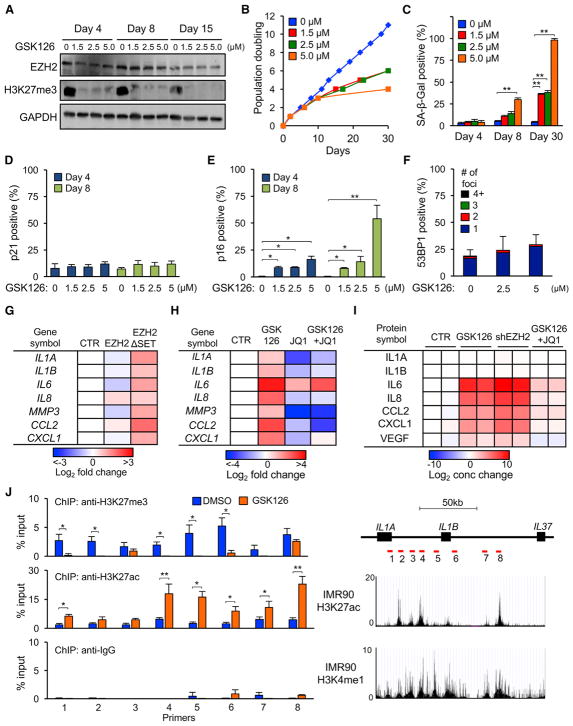
Figure 3. Inhibition of EZH2 Activity Induces Senescence in the Absence of DNA Damage by Depleting H3K27me3 Marks and Activating p16 and SASP Genes.
(A) Early passage LF1 cells were grown continuously in the presence of GSK126, and levels of EZH2 protein and H3K27me3 marks were examined by immunoblotting.
(B and C) Cells were treated with GSK126 as in (A), and proliferation (B) or SA-β-Gal staining (C) were determined (**p < 0.01, n = 3).
(D and E) Cells were treated as in (A), and the frequency of p21-positive (D) and p16-positive (E) cells was scored by IF (percent of total cells, random fields, more than 400 cells per condition, *p < 0.05, **p < 0.01).
(F) Cells were treated with GSK126 for 8 days and examined for 53BP1 foci as in Figure 2G (n = 3).
(G) Cells were infected with lentivirus vectors expressing EZH2 cDNA, EZH2 with an in-frame deletion of the SET domain (EZH2ΔSET), or empty vector control, and expression of the indicated genes was determined by real-time qPCR 9 days after infection. Data are represented as heatmaps relative to control cells (n = 3).
(H) Cells were treated with GSK126 (5 μM), JQ1 (100 nM), or both, and expression of the indicated genes was determined by real-time qPCR after 10 days. Data are represented as heatmaps relative to DMSO-treated cells (n = 3).
(I) Cytokine array analysis of conditioned medium from cells treated with GSK126 (5 μM) or GSK126 plus JQ1 (100 nM) for 17 days. For comparison, cells were infected with shRNAs against EZH2 (shEZH2) or GFP (control [CTR]) for 8 days. IL1A and IL1B were secreted at undetectable levels, as reported previously (Orjalo et al., 2009), because they remain cell surface-associated. Data are represented as heatmaps relative to CTR (n = 2). See Table S3 for the measured cytokine concentrations.
(J) Cells were treated with GSK126 (5 μM) or DMSO for 10 days, and H3K27me3 and H3K27ac enrichment at the IL1A-IL1B-IL37 loci was determined by ChIP-qPCR. Primer pairs were chosen in regions of putative enhancers, and their locations are shown in the schematic as red bars. H3K27ac and H3K4me1 tracks were obtained from ENCODE (GEO: GSM469966 and GSM521895). Normal rabbit IgG was used as the IP control (*p < 0.05, **p < 0.01, n = 3).
Error bars represent SD. See also Figure S5 and Tables S1, S2, and S3.

