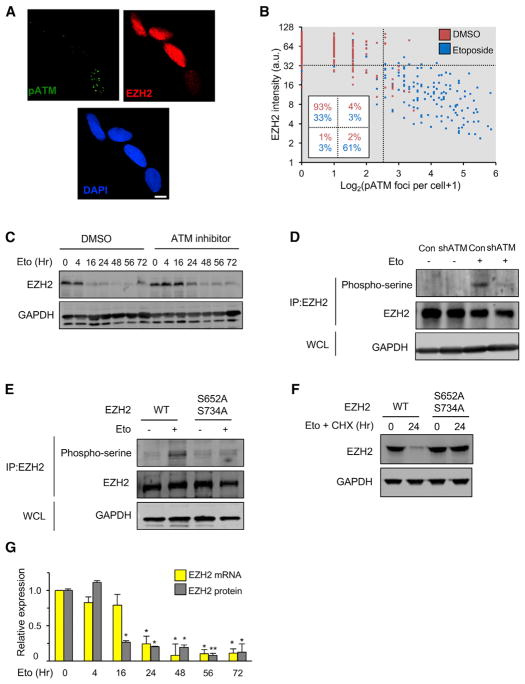
Figure 5. DNA Damage-Mediated Degradation of EZH2.
(A) LF1 cells were treated with etoposide (40 μM) for 8 hr and immunostained with antibodies to phospho-ATM (S1981, green) or EZH2 (red). Nuclei were counterstained with DAPI (blue). The same image is shown in the three channels. Scale bar, 10 μm.
(B) Cells were treated with etoposide for 20 hr, stained as in (A), and scored for EZH2 intensity and the number of phospho-ATM (S1981) foci per nucleus (random fields, more than 200 cells per condition).
(C) Cells were treated with etoposide (Eto) plus the ATM inhibitor KU-55933 (10 μM) or carrier (DMSO), and the levels of EZH2 protein were determined by immunoblotting.
(D) Cells infected with lentivirus vectors expressing shRNA against ATM (or empty vector as control) were treated for 8 hr with etoposide (+) or DMSO vehicle (−). Cell lysates were immunoprecipitated with anti-EZH2 antibody, followed by immunoblotting analysis with anti-phospho-serine or anti-EZH2 antibodies. Aliquots of whole cell lysates (WCLs) were immunoblotted for GAPDH to verify equivalent total protein input.
(E) Cells engineered using lentivirus vectors to stably express EZH2 or EZH2(S652A/S734A) mutant cDNAs were processed and analyzed as in (D).
(F) EZH2 or EZH2(S652A/S734A) mutant cDNA-expressing cells were treated with etoposide and cycloheximide (CHX, 50 μg/mL), and the levels of EZH2 protein were determined by immunoblotting.
(G) Cells were treated with etoposide in a time course, and the relative levels of EZH2 mRNA and EZH2 protein were determined by real-time qPCR and immunoblotting, respectively. The p values shown are pairwise comparisons with the zero time point (*p < 0.05, **p < 0.01, n = 3).

