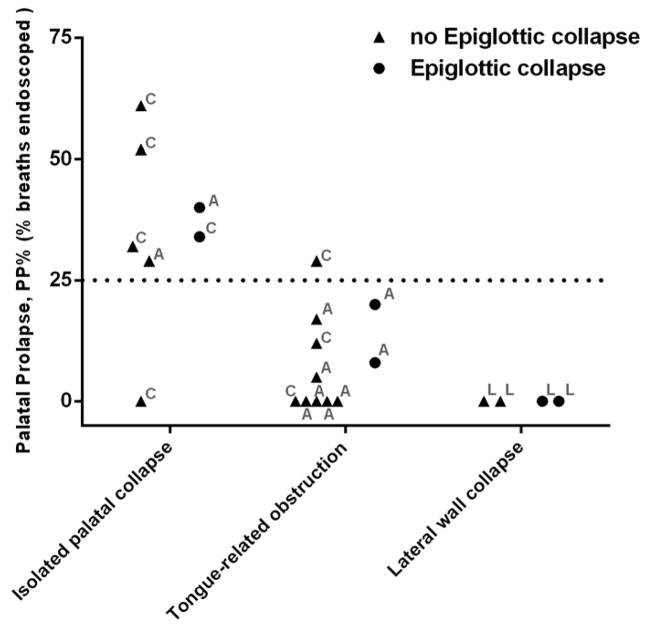
Figure 3.
The scatter plot of %PP (proportion of breaths with palatal prolapse) for all individuals. Patients classified as isolated palatal collapse had significantly higher %PP than patients with tongue-related obstruction and pharyngeal lateral wall collapse. The occurrence of epiglottic collapse was not expected to change the PP%. The direction of airway collapse at the palate is also shown for each individual: concentric (C), anteroposterior (A), or lateral (L). Note that similar threshold of 25% was obtained if the proportion of breaths with EFLI>0.8 (EFL%) was used instead of PP%.

