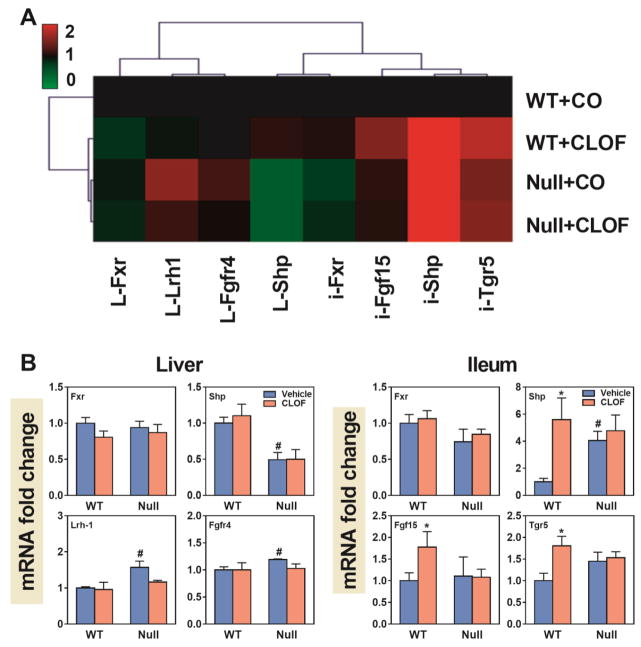
Figure 10. Effects of PPARα activation and deficiency on mRNA expression of genes involved in BA signaling.
(A) Heat map of genes involved in BA signaling pathways in liver and ileum. The colors on the heatmap corresponded to the relative changes in average gene expression. Red represents up-regulation while green represents down-regulation. (2) QuantiGene Plex 2.0 Assay was performed to measure the gene expression of Fxr, Shp, Lrh-1 and Fgfr4 in the liver and Fxr, Shp, Fgf15, and Tgr5 in the ileum. Relative mRNA levels were calculated with vehicle controls set as 100%. Data represent means ± S.E.M. *p<0.05 versus vehicle treatment group; #p<0.05 versus WT group.

