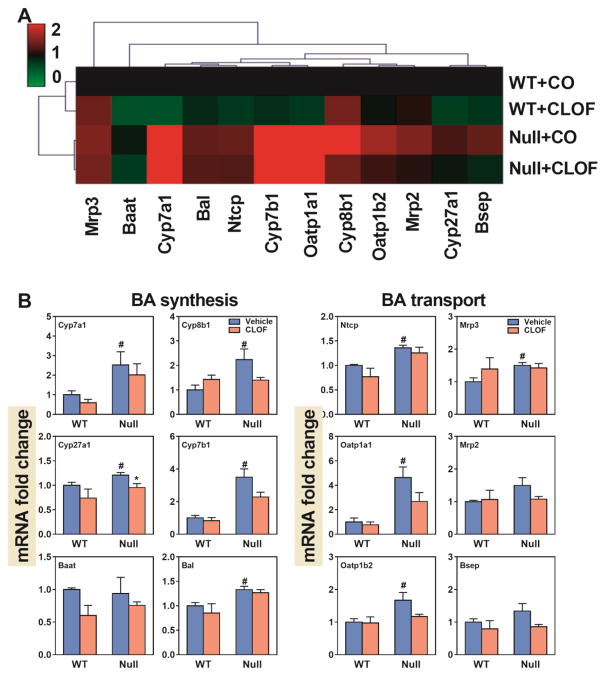
Figure 8. Effects of PPARα activation and deficiency on mRNA expression of BA-synthetic enzymes and transporters in the liver.
(A) Heat map of genes involved in BA synthesis and transport in the liver. The colors on the heatmap corresponded to the relative changes in average gene expression. Red represents up-regulation while green represents down-regulation. (2) QuantiGene Plex 2.0 Assay was performed to measure the gene expression of BA-synthetic enzymes (Cyp7a1, Cyp8b1, Cyp27a1, Cyp7b1, Bal, and Baat) and BA transporters (Ntcp, Oatp1a1, Oatp1b2, Mrp3, Mrp2 and Bsep). Relative mRNA levels were calculated with vehicle controls set as 100%. Data represent means ± S.E.M. *p<0.05 versus vehicle treatment group; #p<0.05 versus WT group.

