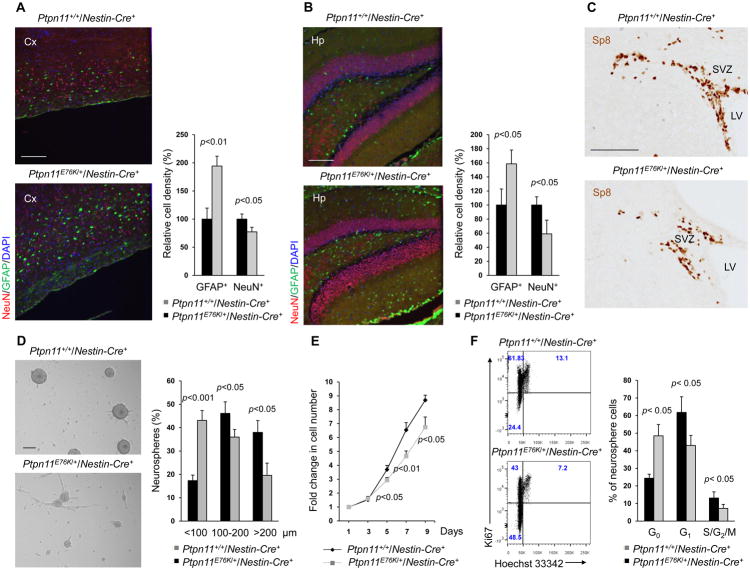
Fig. 2. Ptpn11E76K decreases self-renewal in NSPCs.
Brain sections prepared from one-month-old mice (n=4 mice per genotype) were processed for immunofluorescence staining of NeuN (neurons) and GFAP (astrocytes) in the cortex (A) and hippocampus (B). (C) Brain sections (n=3 mice per genotype) were processed for immunohistochemistry staining for the migrating neuroblast marker Sp8. SVZ, sub-ventricular zone; LV, lateral ventricles. (D–F) Cerebral cortices dissected from E14.5 embryos (n=4 mice per genotype) were assessed by neurosphere assays. (D) Quantification of the size distribution of neurospheres formed by tissue from the indicated genotypes in culture. (E) Total cell numbers at the indicated time points following dissociation of neurospheres into single cells and culture in medium containing bFGF. (F) Cell cycle profiles of the dissociated neurosphere cells as determined by Ki67 and Hoechst 33342 staining followed by FACS analyses (F). Analyses in all panels were performed in 3–4 independent experiments. Data are presented as mean±S.D. of biological replicates. Representative images are shown. Scale bars, 200 μm (A–B upper, D), 100 μm (A–B lower, C).

