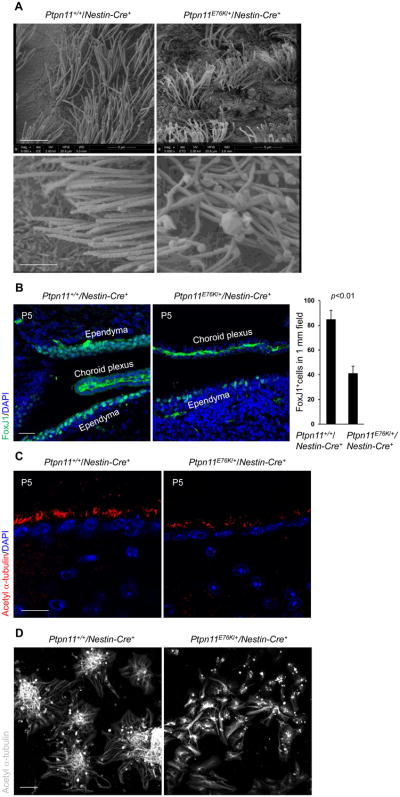
Fig. 3. Aberrant development of ependymal cells and cilia in Ptpn11E76K/+ mice.
(A) Brains dissected from one-month-old mice (n=3 mice per genotype) were processed for scanning electron microscopic analyses. Ependymal cilia on the lateral ventricular walls were examined. Scale bars, 5 μm (upper), 2 μm (lower). (B and C) Brain sections prepared from postnatal day 5 (P5) pups (n=3 mice per genotype) were processed for immunofluorescence staining for the ependymal cell marker FoxJ1 (B) and the cilium marker acetyl α-tubulin (C). The images show the ependymal cells (FoxJ1+, scale bar, 50 μm) and ependymal cilia (acetyl α-tubulin+, scale bar, 20 μm) on the walls of the lateral ventricles in brain sections. FoxJ1+ cells were quantified. Scale bars, 50 μm (B) and 20 μm (C). (D) Lateral ventricular walls dissected from newborn pups (n=3 mice per genotype) were processed for ependymal cell differentiation assays. Differentiated cells were immunostained for acetyl α-tubulin. Scale bar, 50 μm. Analyses in all panels were performed in 3 independent experiments. Data are presented as mean±S.D. of biological replicates. Representative images are shown.

