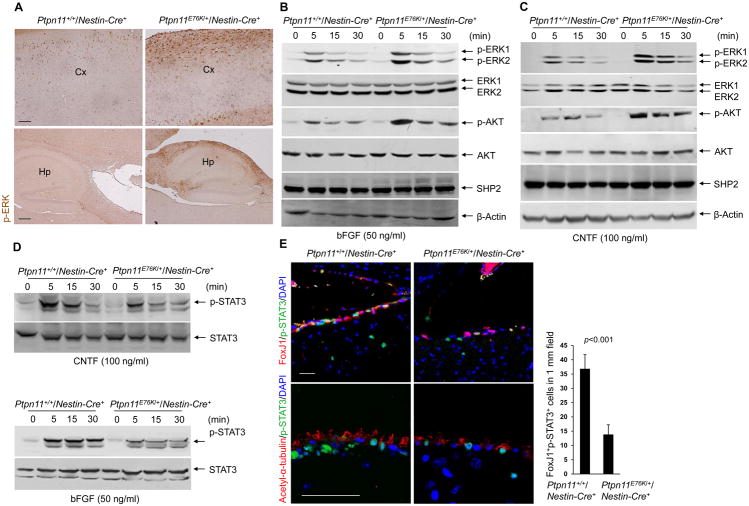
Fig. 4. Ptpn11E76K decreases STAT3 activity and enhances ERK and AKT activity.
(A) Immunohistochemical staining for phosphorylated ERK (p-ERK) in the cortex (Cx) and hippocampus (Hp) of brain sections prepared from one-month-old Ptpn11+/+/Nestin-Cre+ and Ptpn11E76K/+/Nestin-Cre+ mice (n=3 mice per genotype). Scale bars, 100 μm (upper), 200 μm (lower). (B–D) Immunoblot showing p-ERK and p-AKT (B and C) or STAT3 phosphorylated at Tyr705 (p-STAT3, D) in whole cell lysates of neurospheres that were generated from Ptpn11+/+/Nestin-Cre+ and Ptpn11E76K/+/Nestin-Cre+ mice (n=3 mice per genotype), dissociated into single cells, and stimulated with bFGF or CNTF as indicated. Densitometric data of phosphoproteins (normalized to the total abundance of the respective proteins) are summarized in Fig. S6B–S6D. (E) Immunofluorescence staining for FoxJ1, acetyl α-tubulin, and phosphorylated STAT3 in brain sections prepared from one-month-old Ptpn11+/+/Nestin-Cre+ and Ptpn11E76K/+/Nestin-Cre+ mice (n=3 mice per genotype). Scale bar, 50 μm. Double-positive FoxJ1+p-STAT3+ cells were quantified. Analyses in all panels were performed in 3 independent experiments. Data are presented as mean±S.D. of biological replicates. Representative images are shown.

