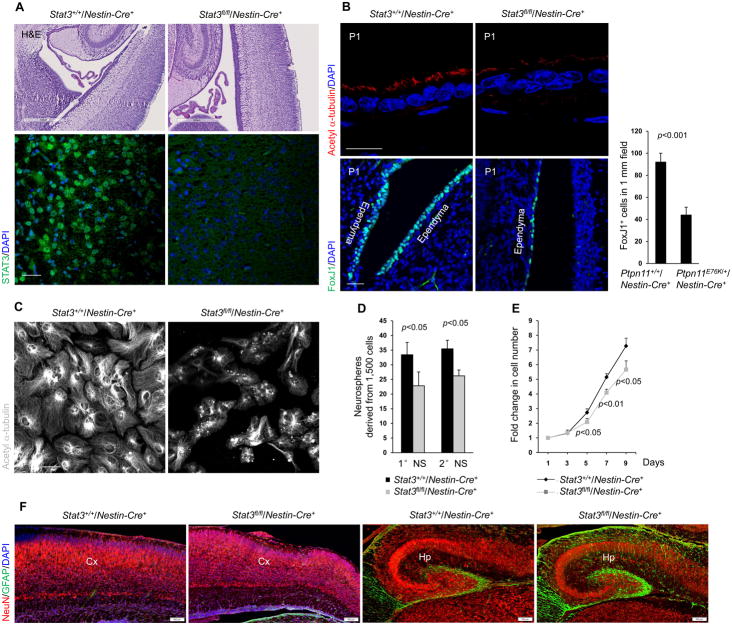
Fig. 5. Depletion of STAT3 in neural cells results in developmental defects in ependymal cells and cilia.
Immunohistochemical and immunofluroescence staining showing (A) STAT3 and (B) acetyl α-tubulin and FoxJ1 in ependymal cells on the walls of the lateral ventricles in brain sections of newborn Stat3+/+/Nestin-Cre+ and Stat3fl/fl/Nestin-Cre+ pups (n=3 mice per genotype). FoxJ1+ cells were quantified (B). Sacle bars, 500 μm (A, upper), 50 μm (A, lower and B, lower), 20 μm (B, upper). (C) Acetyl α-tubulin in cells isolated from lateral ventricular walls dissected from newborn Stat3+/+/Nestin-Cre+ and Stat3fl/fl/Nestin-Cre+ pups (n=3 mice per genotype). Scale bar, 50 μm. (D) Quantification of the number of primary neurospheres (1 °NS) and secondary neurospheres (2° NS) derived from cerebral cortices dissected from E14.5 embryos (n=3 mice per genotype) of the indicated genotypes. (E) Quantification of the proliferation of cells in primary neurospheres derived from the indicated genotypes. (F) Immunofluorescence staining of brain sections from newborn Stat3+/+/Nestin-Cre+ and Stat3fl/fl/Nestin-Cre+ pups (n=3 mice per genotype) showing the neuron marker NeuN and the astrocyte marker GFAP. Scale bar, 100 μm. Analyses in all panels were performed in 3 independent experiments. Data are presented as mean±S.D. of biological replicates. Representative images are shown.

