
Fig. 3. Modulation of lysosomal activity in qNSCs affects protein aggregates and the transition from quiescence to activation.
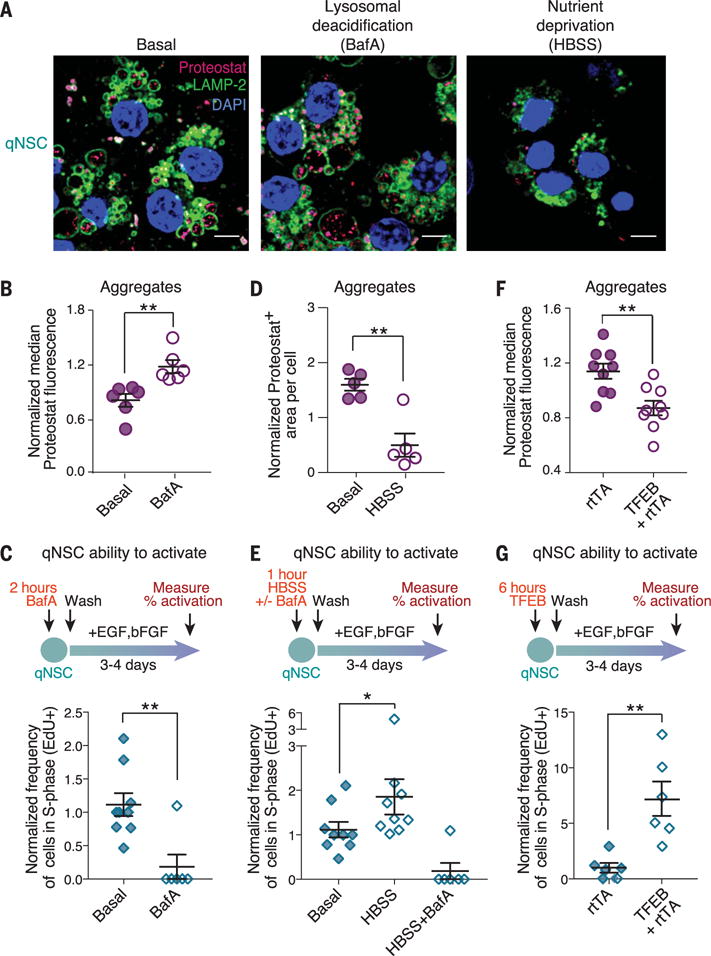
(A) Representative immunofluorescence images of primary cultures of qNSCs from 3-month-old mice after 18 hours of treatment with 50 nM bafilomycin A (BafA, a lysosomal V-ATPase inhibitor) or 3 hours of nutrient deprivation in HBSS. Cells are stained with Proteostat (magenta, protein aggregates), LAMP-2 (green, lysosomal membranes), and DAPI (blue, nuclei). Scale bars, 5 μm. Basal, quiescence media. (B) Median Proteostat fluorescence normalized to the median value per replicate to combine samples prepared at different times. Mean ± SEM of values from six biological replicates analyzed by flow cytometry on two different days. Each point represents an independent primary culture derived from two 3- to 4-month-old mice. (C) Percentage of cells that incorporated 5-ethynyl-2′-deoxyuridine (EdU) (cells in S phase of the cell cycle) during a 3-hour pulse, as measured by intracellular flow cytometry. Mean ± SEM of values from nine different biological replicates analyzed on four different days. Each point represents one independent primary culture derived from two 3- to 4-month-old mice. (D) Differences in Proteostat+ area quantified from images. Mean ± SEM of values from five independent biological replicates from two independent experiments. (E) Percentage of cells that incorporated EdU measured as in (C). Mean ± SEM of values from nine different biological replicates analyzed on four different days. (F) Proteostat fluorescence measured as in (B). Mean ± SEM of values from nine biological replicates analyzed on three different days. rtTA, reverse tetracycline-controlled transactivator. (G) Percentage of cells that incorporated EdU measured as in (C). Mean ± SEM of values from six different biological replicates analyzed on two different days. For all panels, P values determined by one-sided Wilcoxon rank sum test. *P ≤ 0.05; **P ≤ 0.01.