
Figure 6.
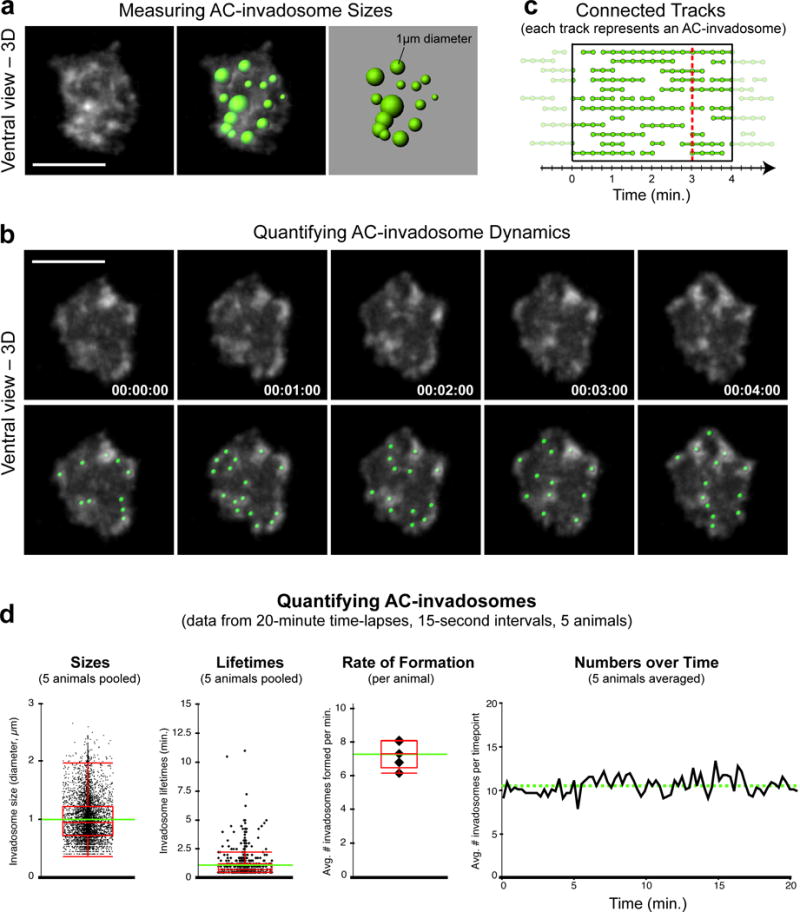
Quantifying AC-invadopodia dynamics. (a) Images show a single time point, ventral view perspective of AC-invadopodia, enriched in the F-actin probe mCh∷moeABD (left). Variably-sized spots (right) representing AC-invadopodia sizes that were generated in Imaris based on the mCh∷moeABD signal (right) are overlaid onto the fluorescent image (middle).(b) Time series montage shows five frames of the F-actin-rich AC-invadopodia at 1-minute intervals (top). Green spots were used to track AC-invadopodia dynamics (bottom). Scale bars represent 5 μm. (c) Diagram shows several tracks (connected spots) within the highlighted 4-minute window. Each track represents the lifetime of a single AC-invadopodia. (d) Graphs display quantitative measurements of wild-type AC-invadopodia that were acquired using the spot-tracking function in Imaris. Intra-animal variability of pooled data was negligible. Images in (b) and graphs in (d) were adapted from Hagedorn et al., 2013.