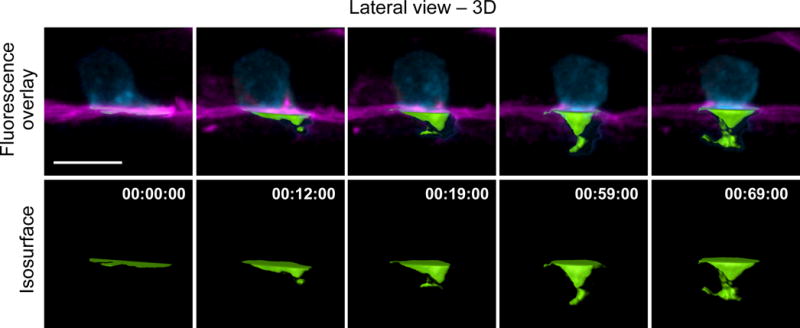
Figure 7.

Using isosurfaces to make spatial measurements. Time-series montage shows 3D reconstructions at several time points over the course of AC invasion. The AC is expressing the PI(4,5)P2 sensor mCherry∷PLCδPH (cyan); the BM is labeled with LAM-1∷GFP (magenta). Isosurface renderings (green) were used to measure the volume of the AC’s invasive protrusion that had extended through the BM. Scale bar represents 5 μm.
